

- USD/CNH broke below 200DMA, key trendline and horizontal support on Friday
- Move occurred in illiquid trade during mainland China’s May Day holidays
- Monday's hammer candle hints at possible reversal, adding to the uncertainty
- CNH moves could weigh heavily on AUD and NZD given near-perfect recent correlations
- MACD and RSI suggest growing downside momentum—bearish setups favoured for now
Summary
An abrupt strengthening in the offshore traded Chinese yuan that saw it break several key technical levels in illiquid trade on Friday is about to be put to the test as mainland Chinese markets resume on Tuesday. What happens next could prove highly influential for the U.S. dollar’s fortunes against other Asian currencies, particularly the Australian and New Zealand dollars given the exceptionally tight correlations between the three against the greenback last week.

USD/CNH: Bear Trap or Start of Strengthening Trend
The sizeable bearish candle in USD/CNH on Friday was hard to miss, with the pair closing beneath the 200-day moving average, the December 2024 downtrend, and minor horizontal support at 7.2130. The price action hints USD/CNH may be on the cusp of a renewed CNH strengthening trend. But with the move coming at the start of the May Day holidays—a period typically marked by thin liquidity as mainland Chinese markets close for an extended long weekend—it’s a signal that demands scrutiny. It may ultimately prove a large bear trap as turnover normalises on Tuesday.
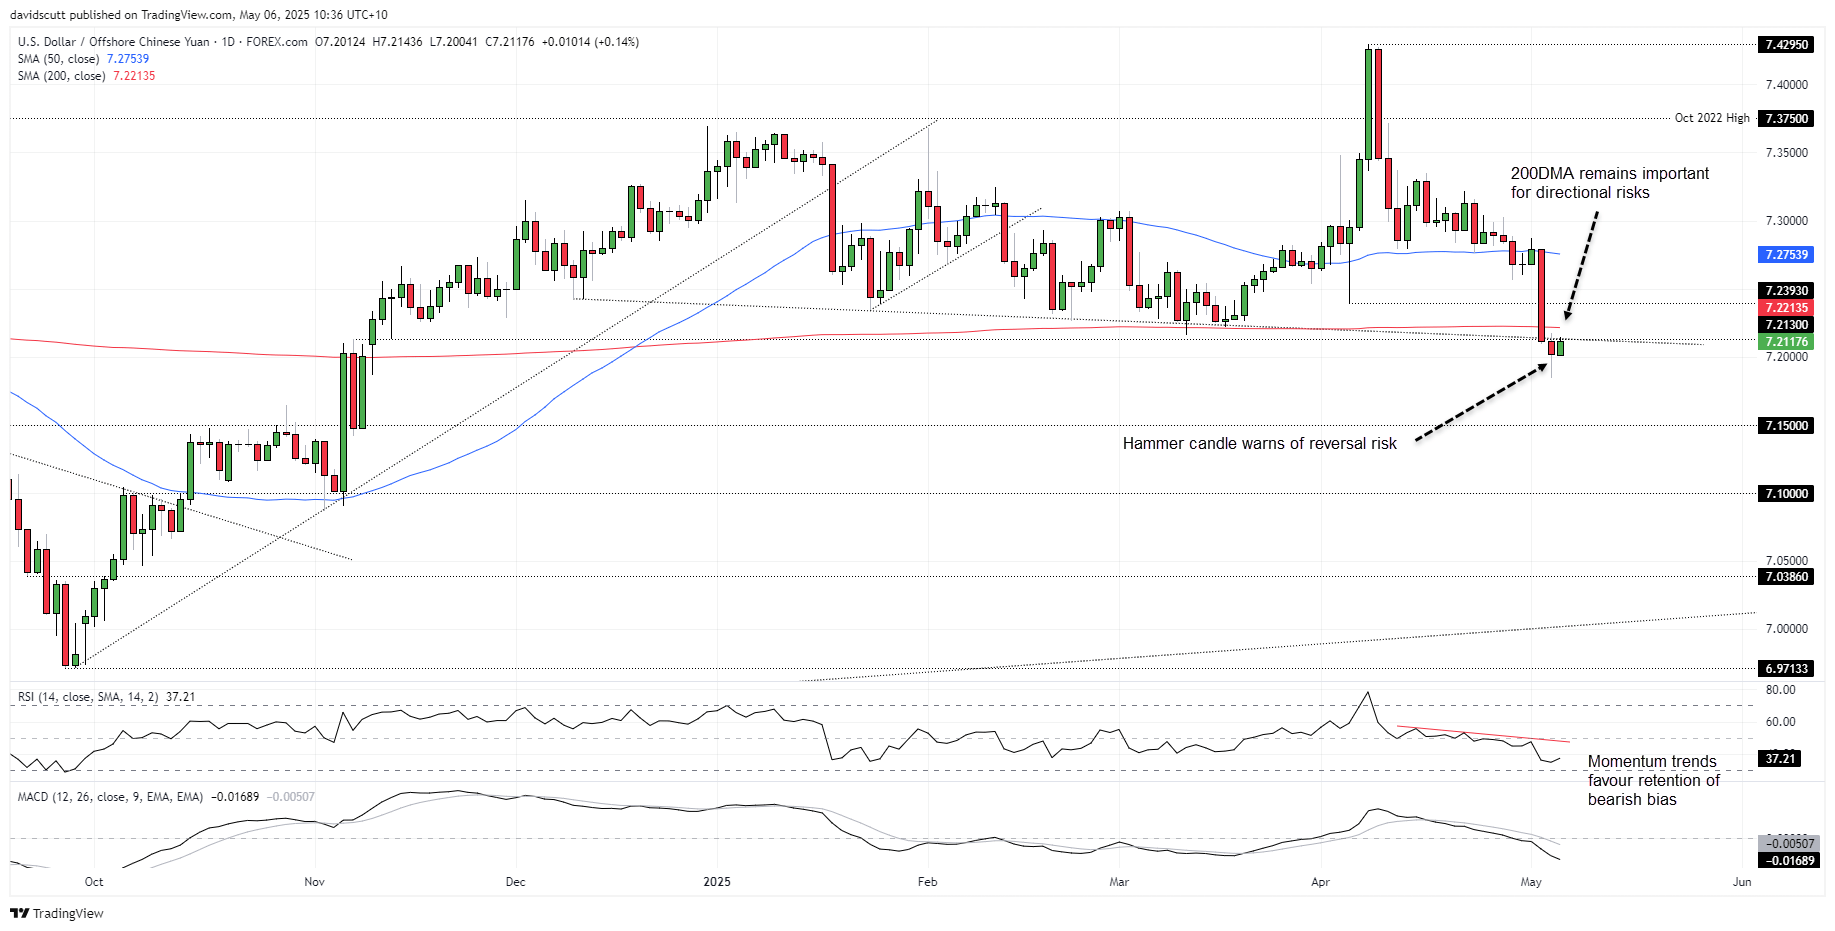
Source: TradingView
Monday’s hammer candle warns of reversal risk, though it too came amid holiday-affected trade. Should USD/CNH break and close back above the 200DMA today, it would suggest Friday’s move was a false break, opening the door to further upside—and downside for Asia FX more broadly. Correlations remain tight: on the daily timeframe over the past week, AUD and NZD logged correlation coefficients with CNH of 0.99 and 0.88 respectively—about as close to perfect as you’ll find.
Support sits at Monday’s low near 7.1850, followed by 7.1500 and 7.1000. Above the 200DMA, the April 4 low at 7.2393 is the first hurdle for bulls, with a break targeting the 50DMA.
Indicators such as MACD and RSI (14) point to increasing downside momentum, supporting a bearish bias. Selling rallies and downside breaks may remain the preferred strategy for now.
-- Written by David Scutt
Follow David on Twitter @scutty
Latest market news
Yesterday 11:45 PM
Yesterday 10:52 PM
Yesterday 10:39 PM
Yesterday 07:05 PM
Yesterday 05:19 PM

Yesterday 11:45 PM


Yesterday 10:52 PM

Yesterday 02:22 AM