

View related analysis:
- EUR/USD, USD/JPY, USD/CAD Outlook: US Dollar Slammed Ahead of PCE Inflation
- Japanese Yen Slips, Wall Street Futures Rally as US Court Blocks Trump’s Tariffs
- Gold at Technical Crossroads Ahead of GDP, PCE; ASX 200 Stalls at Resistance
- Australian Dollar Outlook: Higher CPI Unlikely to Deter RBA Cut
COT data shows mixed signals across major asset classes. USD net shorts edged higher, while gold and silver longs rose. Wall Street futures show divergence, but traders await clearer cues from trade headlines and key market levels.
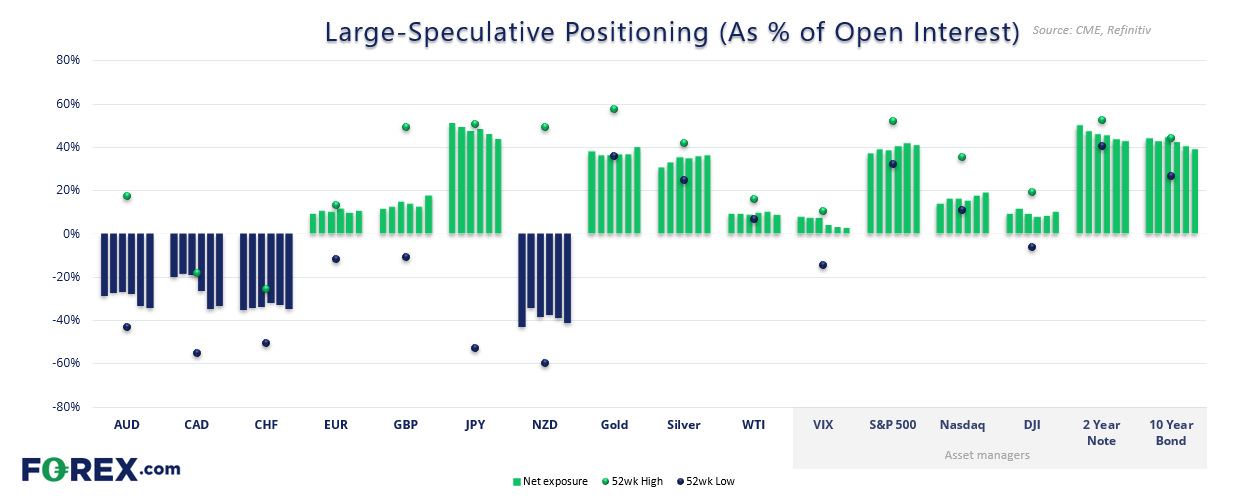
Weekly Market Positioning Overview – COT Report Highlights (27 May 2025)
- US Dollar (USD): Futures traders effectively increased net-short exposure to the USD by 1.3k contracts
- European dollar (EUR): Large speculators and asset managers increased their net-long exposure by a combined 8.7k contracts
- British pound (GBP): Large specs increased net-long exposure by 11.4k contract, asset managers trimmed net-short exposure by -1.4k contracts
- Japanese yen (JPY): Large speculators reduced net-short exposure by -3.4k contracts
- Australian dollar (AUD): Net-short exposure increased by 2k contracts among large specs, though asset managers trimmed their by -1.6k contracts
- Canadian dollar (CAD): Asset managers trimmed net-short exposure by 13.8k contracts
- Swiss franc (CHF): Net-short exposure increased by 1.8k contracts, to a 5-week high
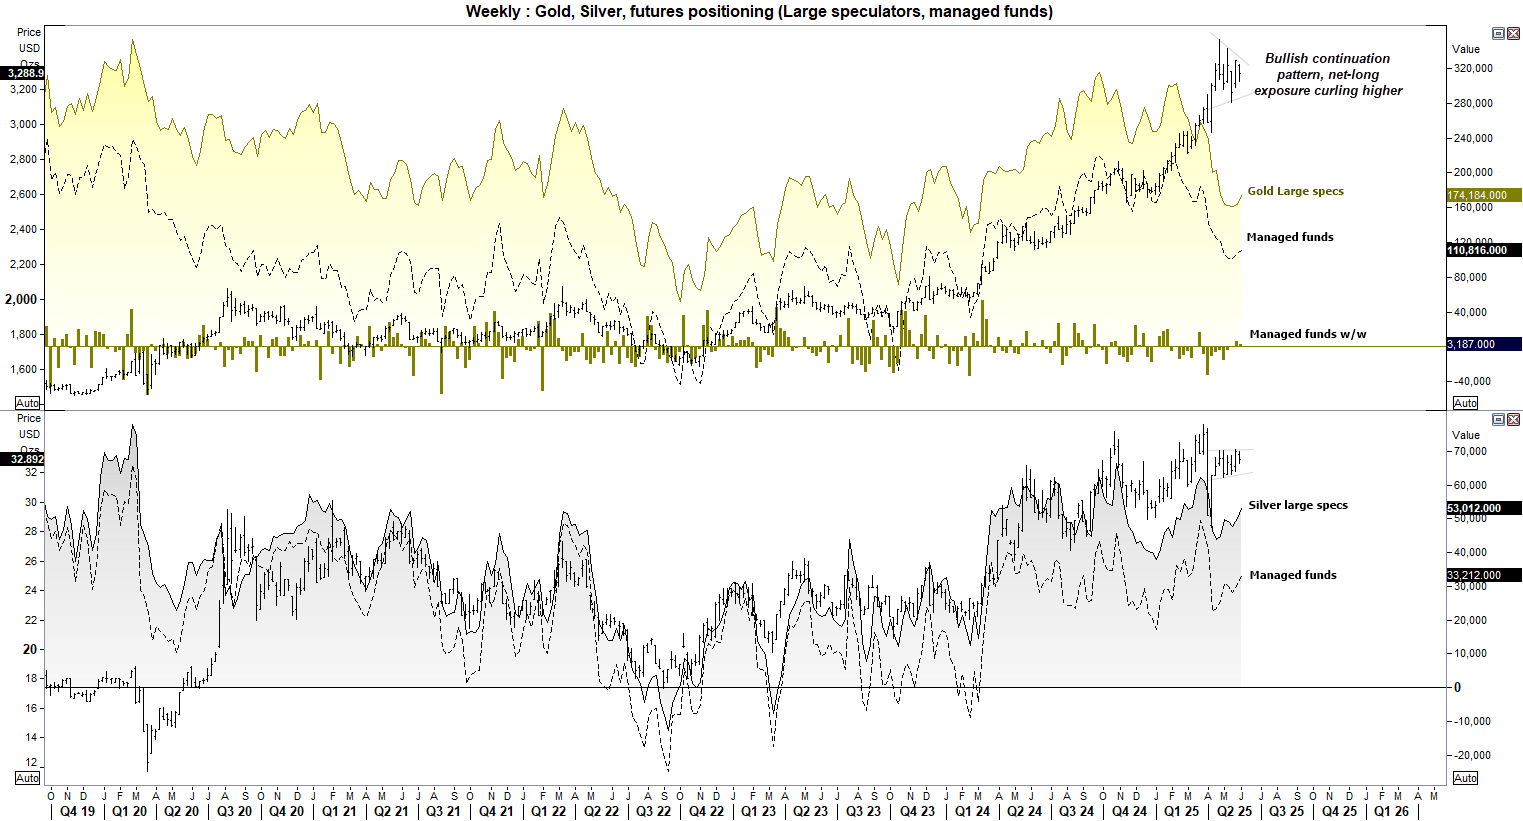
- Gold (GC): Large specs and managed funds increased net-long exposure by a combined 13.4k contracts
- Silver (SI): They also increased net-long exposure by a combined 5.7k contracts
- Crude Oil (WTI): Large specs and managed funds decreased net-long exposure by a combined 28.7k contracts
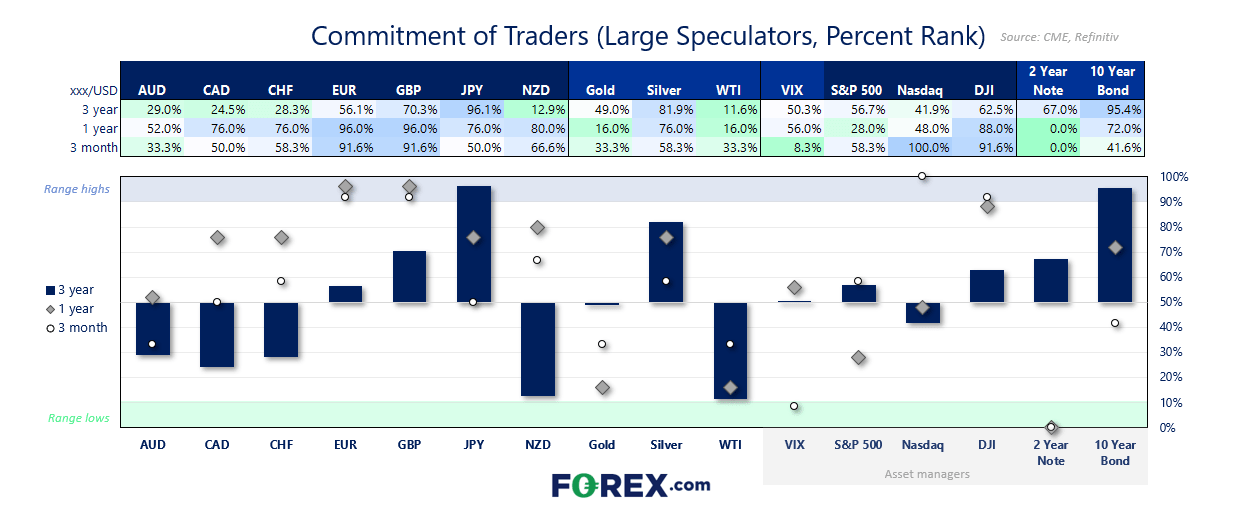

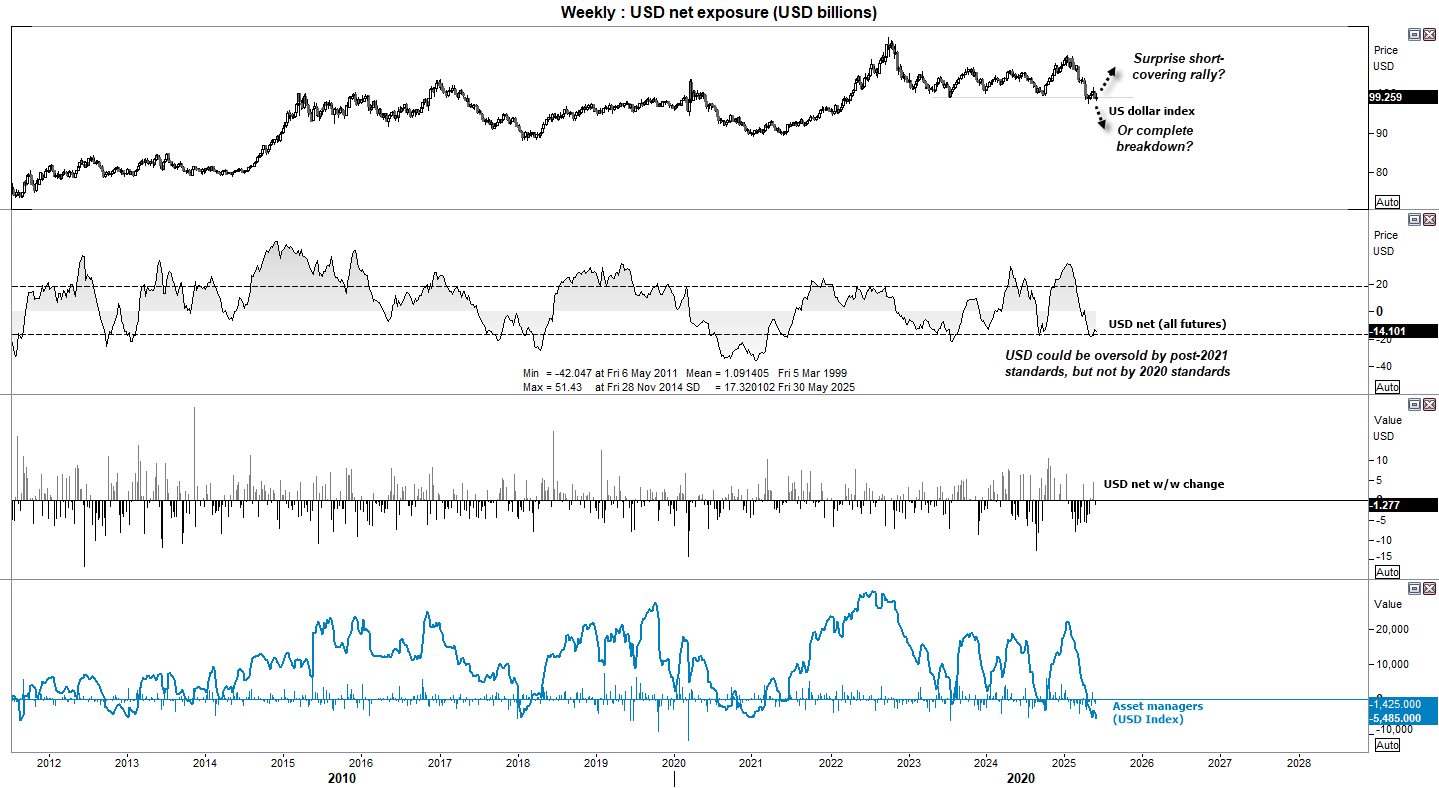
US Dollar Positioning (IMM Data): Weekly COT Report Analysis
Is the US dollar oversold? It depends on where we measure it from. Net-short exposure to overall USD exposure is moving around its lower 1-standard deviation band, which could be considered from post-2021 standards. But we have seen higher levels of net-short exposure to the USD in 2020.
The USD index is meandering around the 100 handle and the 2023 lows. This seems to be a pivotal level, and the difference between a surprise short-covering rally or a complete breakdown of the greenback. And which way it goes is completely in the hands of Trump and his policies.
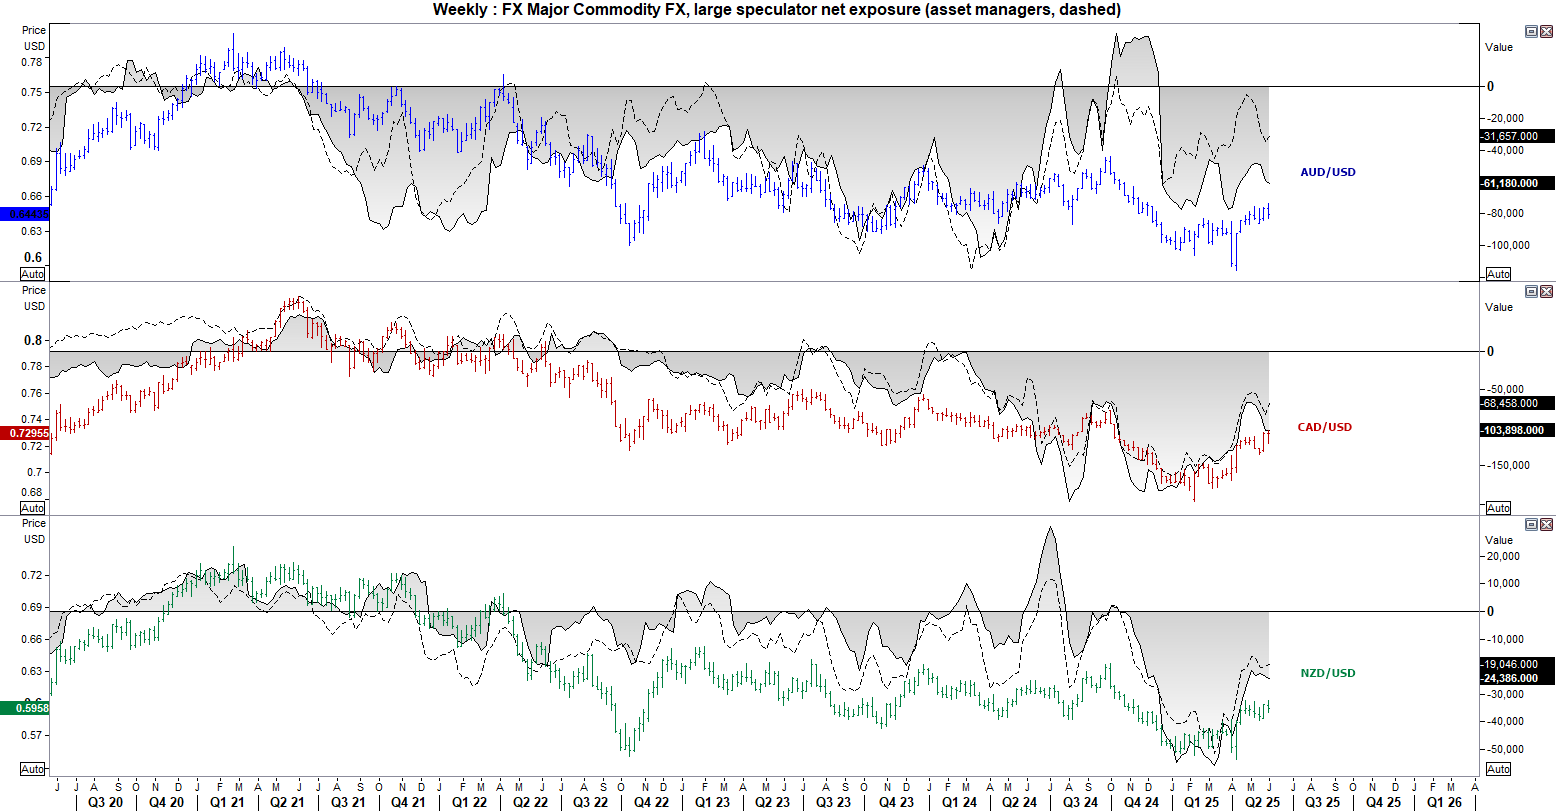
Commodity FX Positioning (AUD, CAD, NZD): Weekly COT Report Overview
Another case of mixed signals. Large speculators reduced net-shott exposure to AUD, CAD and NZD futures yet asset managers increased net-shot exposure. Effectively cancelling each other out. Their direction is to be mapped out by Trumps and his trade war.

Metals (Gold, Silver, Copper) Futures - COT report
I’m coming around to the potential that gold is not ready to deliver a deeper retracement. Net-short exposure has been falling since Q3, yet prices have not. Net-long exposure is now curling up, which suggests bulls have come around to the same conclusion. Gold may now be priming itself for an almighty bullish breakout.
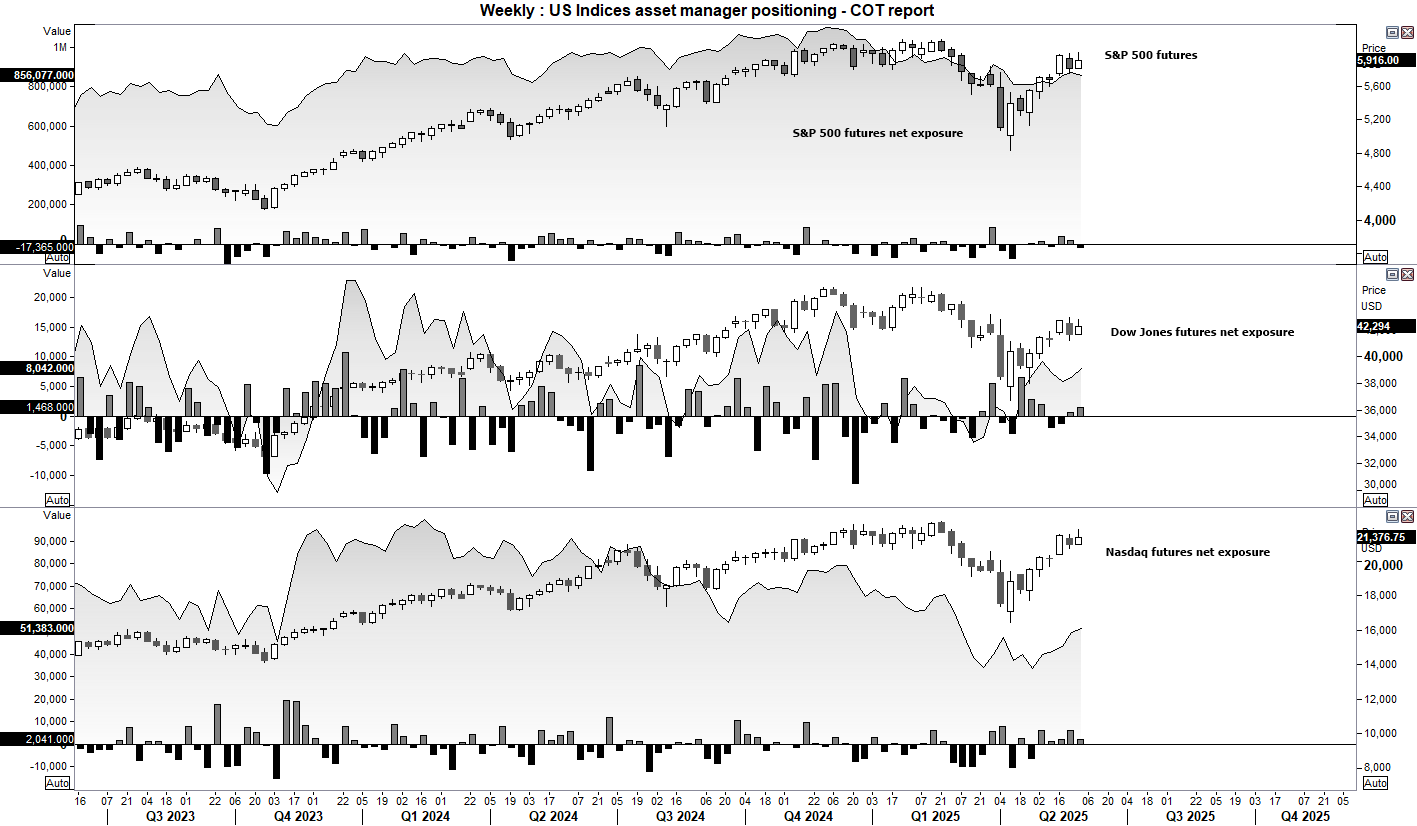
Wall Street Indices Positioning (S&P 500, Dow Jones, Nasdaq 100): Weekly COT Report
Mixed signals from Wall Street positioning, with net-long exposure falling on S&P 500 futures and rising on Dow Jones and Nasdaq 100 futures. Ultimately, there are no compelling signs from market exposure, so one may be better off focusing on price action. We’ve seen a multi-week rally, though volatility has diminished and prices have effectively moved sideways over the past two weeks. That means volatility awaits, but the breakout direction is likely down to which way trade talks go: strong tariffs are likely bearish for indices, weak tariffs likely bullish.
Latest market news
September 18, 2025 02:48 PM
June 23, 2025 01:22 PM
June 23, 2025 10:39 AM
June 20, 2025 05:23 PM
June 20, 2025 04:46 PM
June 20, 2025 02:18 PM

June 19, 2025 09:09 AM

June 18, 2025 02:55 PM

June 18, 2025 08:19 AM

June 18, 2025 02:21 AM