

USD, U.S. Dollar Talking Points:
- April is closing as another red month for the USD but context is important here, as the bulk of losses were relegated to the first 11 days of the month.
- Shorter-term, there’s a few different items that point to pullback potential such as an oversold RSI reading on the weekly chart and a inverse head and shoulders pattern on the four-hour chart, both looked at in the video below.
- The big question is whether a pullback can turn into anything more at this point, or whether sellers jump on a lower-high to continue the broader down-trend, and those are questions that can move closer to resolution in the month of May.
It’s been a beat down in the USD so far in 2025 and that’s an interesting turn of events given how bullish the Dollar was coming into the year. It seemed as though parity calls for the EUR/USD were commonplace but after two months of stall to start the year, EUR/USD began to turn-higher in March as recession fears took over in the U.S. and then April has so far shown as another very bullish monthly bar for the pair.
But – context is important here as that move came on rather quick. EUR/USD hit 1.1400 on the 11th of April and has largely spun its wheels since, with a similar look as the U.S. Dollar which hit a low on April 11th and as of today, continues to trade above that price.
There was a dip in DXY along the way, however, with a massive spot of support coming into play and holding the lows. This is the trendline projection taken from 2001 and 2020 highs which is confluent with the 38.2% Fibonacci retracement of the 2008-2022 major move.
US Dollar Monthly Chart
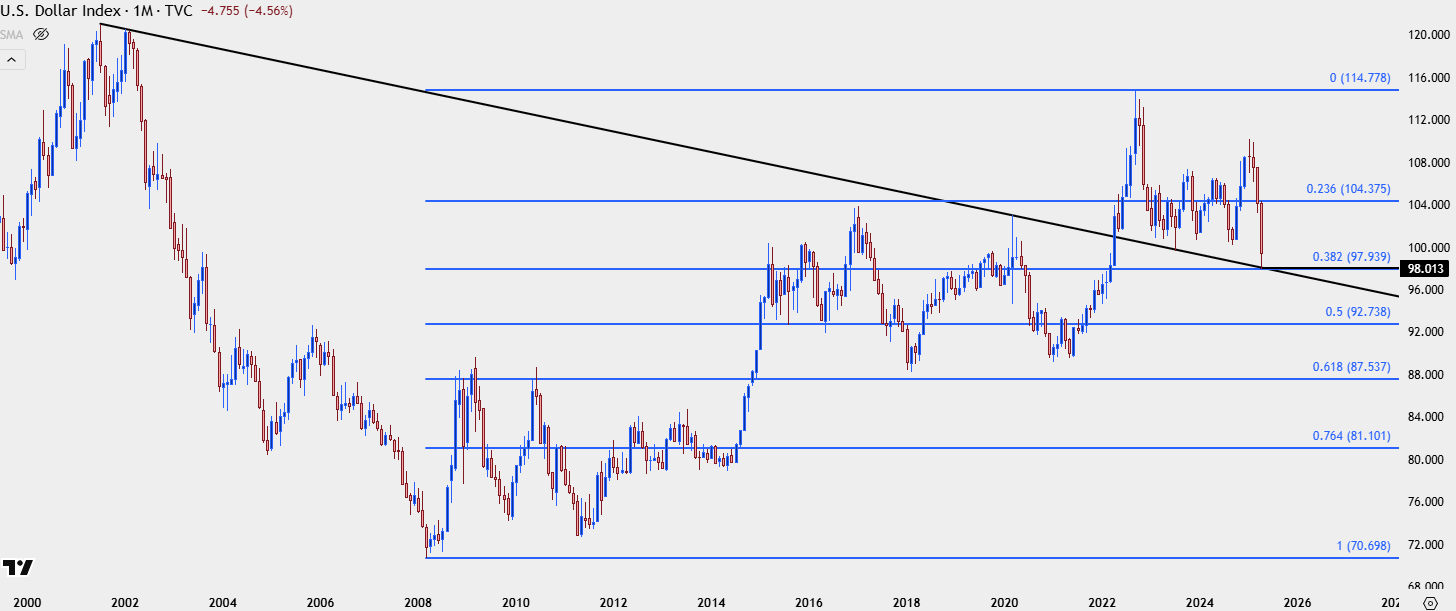 Chart prepared by James Stanley; data derived from Tradingview
USD Weekly
The weekly chart provides some important context here as it highlights how the bulk of that move showed earlier in the month, with stalling taking over for the past few weeks. There’s also an oversold element to consider as RSI on the weekly remains in oversold territory, and that’s somewhat of a rare occurrence as it’s only happened a couple other times in the past six years. Most recently, it showed last August – and sellers pushed for another five weeks before eventually the Q4 bullish reversal took over. So an oversold RSI reading on the weekly doesn’t automatically spell reversal – but it does highlight that chasing the trend lower especially while at or near support could be challenging. That can lead to stalling in the move, such as we’ve seen, which can then bring on profit taking from shorts to lead into more demand.
US Dollar Weekly Chart
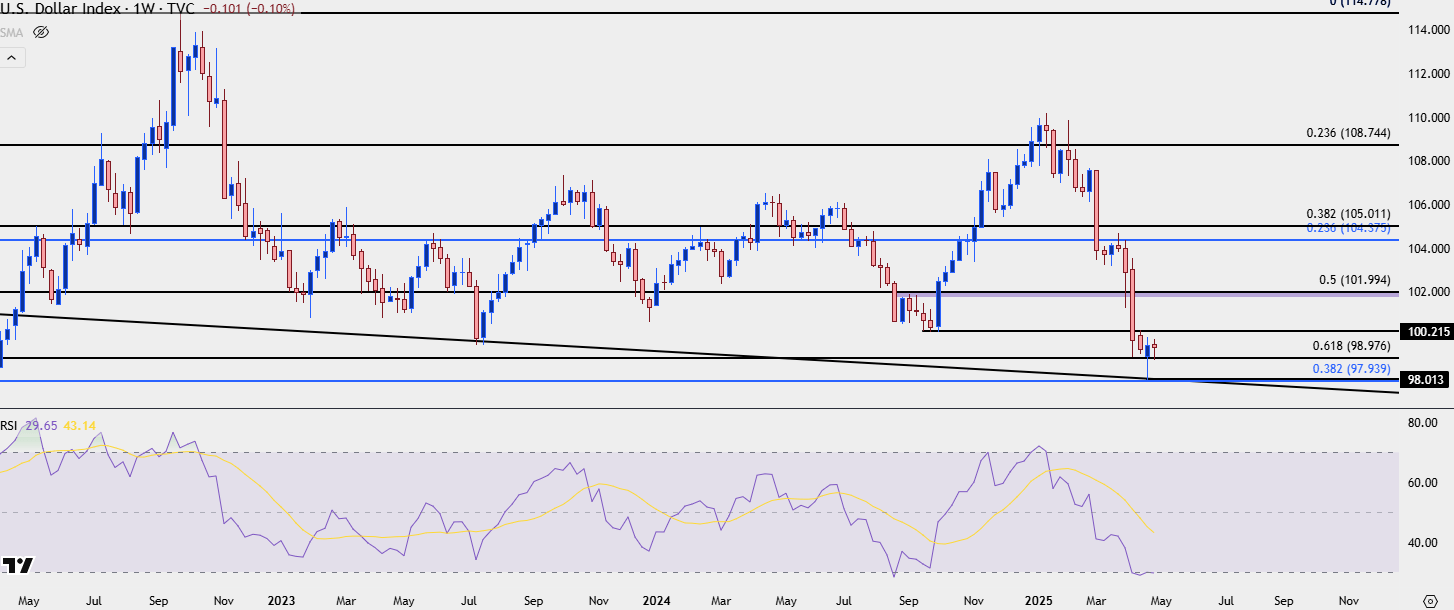 Chart prepared by James Stanley; data derived from Tradingview

USD Short-Term
Combining the above into a shorter-term look, the USD has built into an inverse head and shoulders pattern on the four-hour chart, and there’s a mirror image head and shoulders pattern currently showing in EUR/USD which I had looked at in the video. This similarly points to pullback potential in the DXY and for that, levels at 100.22 and 102.00 remain of interest as each would present an opportunity for sellers to jump on the move after pullback.
US Dollar Four-Hour Price Chart
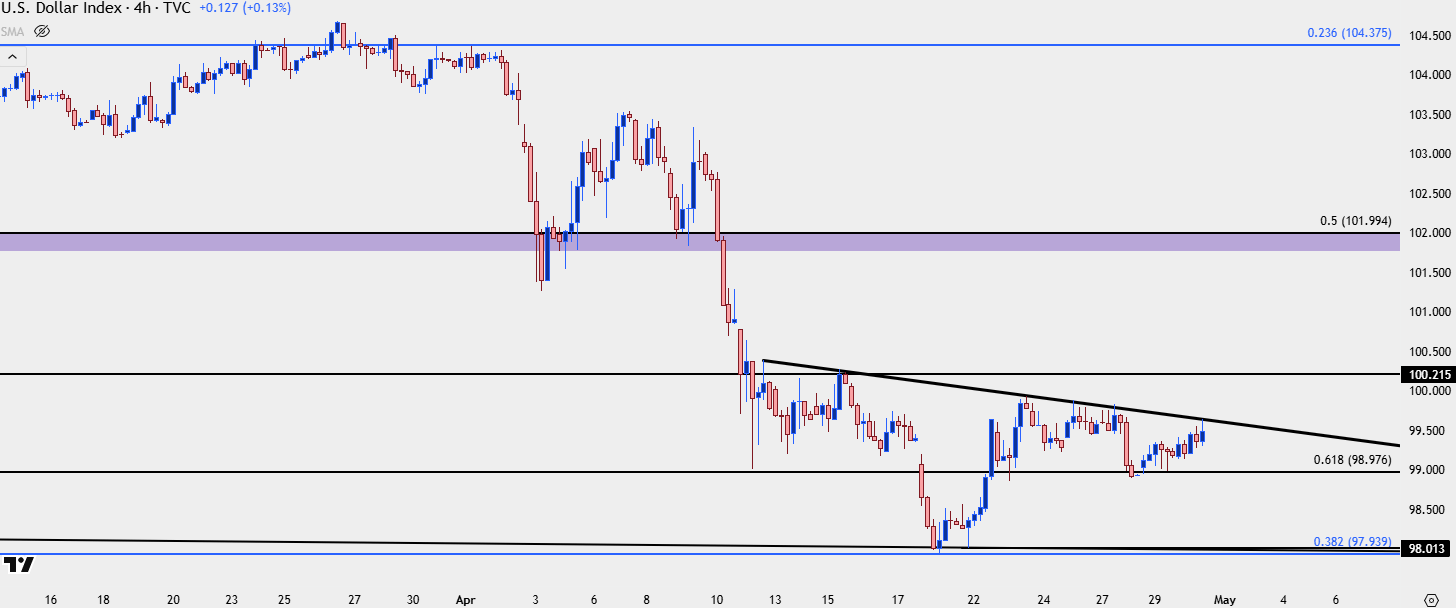 Chart prepared by James Stanley; data derived from Tradingview
--- written by James Stanley, Senior Strategist
Latest market news
September 18, 2025 02:48 PM
June 23, 2025 01:22 PM
June 23, 2025 10:39 AM
June 20, 2025 05:23 PM
June 20, 2025 04:46 PM
June 20, 2025 02:18 PM

June 19, 2025 09:09 AM

June 18, 2025 02:55 PM

June 18, 2025 08:19 AM

June 18, 2025 02:21 AM