

US Dollar Talking Points:
- This webinar was about perspective as different time frames can show different trends. From the weekly chart or from shorter-term charts, USD bears have potential to make a push. From the daily and four hour charts, however, there remains a bullish lean, helped along by a hold of key resistance in EUR/USD and a strong short-term reaction in USD/JPY.
- For USD-weakness, USD/CAD and GBP/USD remain of attraction and in this webinar I also took an in-depth look at Gold, following up on the setup looked at in Friday’s webinar as a higher-low had started to show.
- If you’d like to attend the next live webinar: Click here to register.
In late-April selling the USD was a challenge, as DXY had pushed into oversold territory on the weekly chart for only the second time in the past seven years, and a long-term spot of support came into play.
That led into four weeks of strength, currently capped by the resistance hold at 102 that showed last Monday. From the weekly chart, this remains a bearish trend and given that reaction at resistance, bears have an open door to make another push. The daily and four hour charts, however, paint a different picture.
US Dollar Weekly Chart
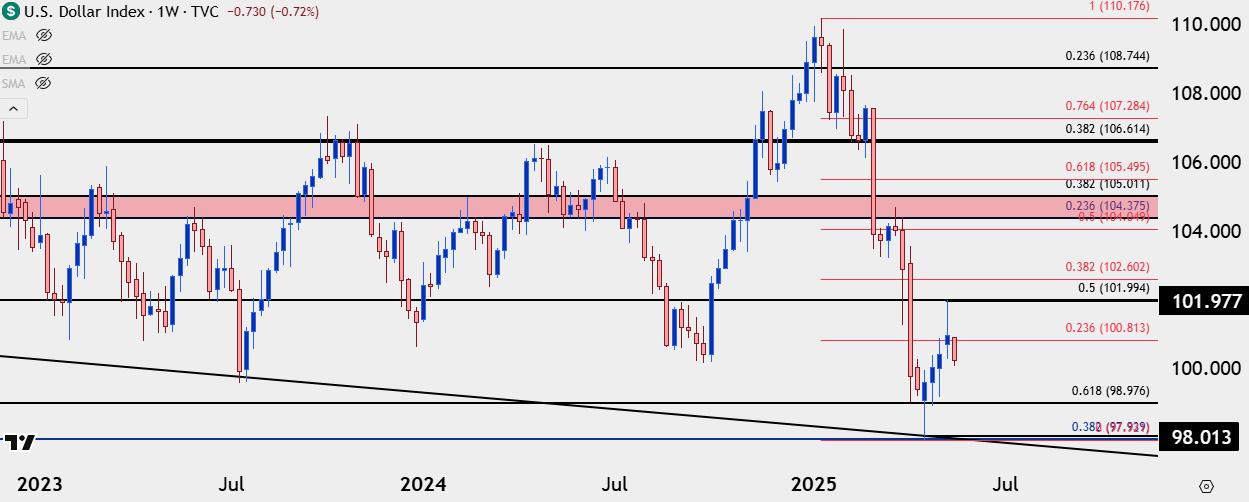 Chart prepared by James Stanley; data derived from Tradingview
On the daily chart there’s still a bullish argument to be made around the USD as price has, so far, held support at prior resistance, right around the same trendline projection that was in-play yesterday. Whether this pans out will likely have some relation with whether EUR/USD bulls can finally force a break above the 1.1275 Fibonacci level, and if that happens, the above longer-term bearish scenario in USD takes on more attraction. But – for USD weakness, there may be more amenable pastures elsewhere, such as GBP/USD or USD/CAD.
US Dollar Daily Price Chart
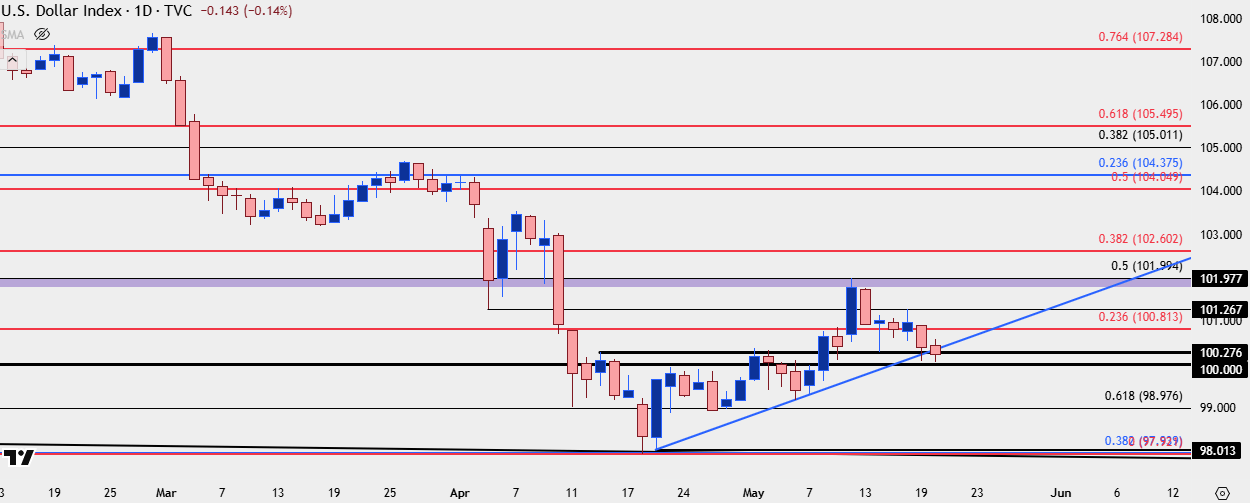 Chart prepared by James Stanley; data derived from Tradingview
GBP/USD
GBP/USD has put in a v-shaped reversal for price to run right back up to resistance, the same resistance that was in-play last year, taken from the 78.6% Fibonacci retracement of the 2021-2022 major move. Comparably, the same major move in EUR/USD has the 61.8% retracement at 1.1275, which is showing resistance in that pair, illustrating the greater relative strength in Cable versus EUR/USD.
More interesting than that, however, is the continued push at that resistance over the past four weeks, with last week showing sellers getting rebuked after attempting a deeper pullback. That price now has breakout potential and the next major level overhead is the 1.3500 psychological level; and if looking for USD-weakness, I think this could carry more attraction than breakouts in EUR/USD given the current backdrop.

GBP/USD Weekly Price Chart
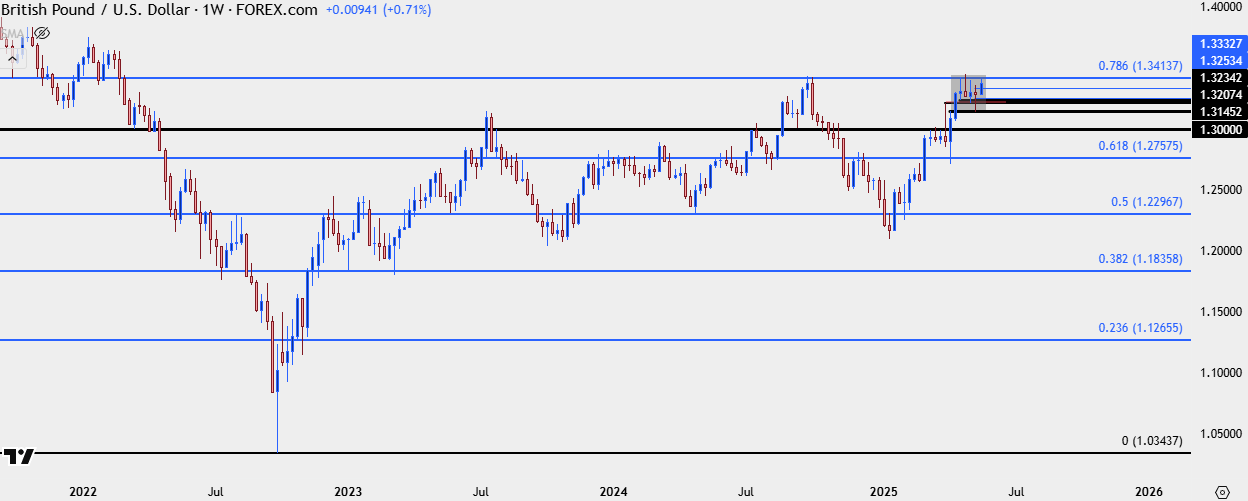 Chart prepared by James Stanley; data derived from Tradingview
USD/CAD
I’m also of the mind that USD/CAD is a more interesting major pair for USD-weakness scenarios than EUR/USD. It’s the longer-term range that applies here and, so far, that 1.4000 level has held resistance on multiple occasions after an oversold backdrop appeared in April. This keeps the door open for bearish continuation in USD/CAD and if that resistance doesn’t hold, there’s another zone overhead that may carry more attraction. If we do see a 1.4000 break then we’re likely also seeing an extension of the bullish backdrop in DXY, and I would be inclined to press that in EUR/USD moreso than USD/CAD. But – for a reaction from that, deeper resistance potential at 1.4149-1.4178 looms in USD/CAD, as I wrote about yesterday.
USD/CAD Daily Chart
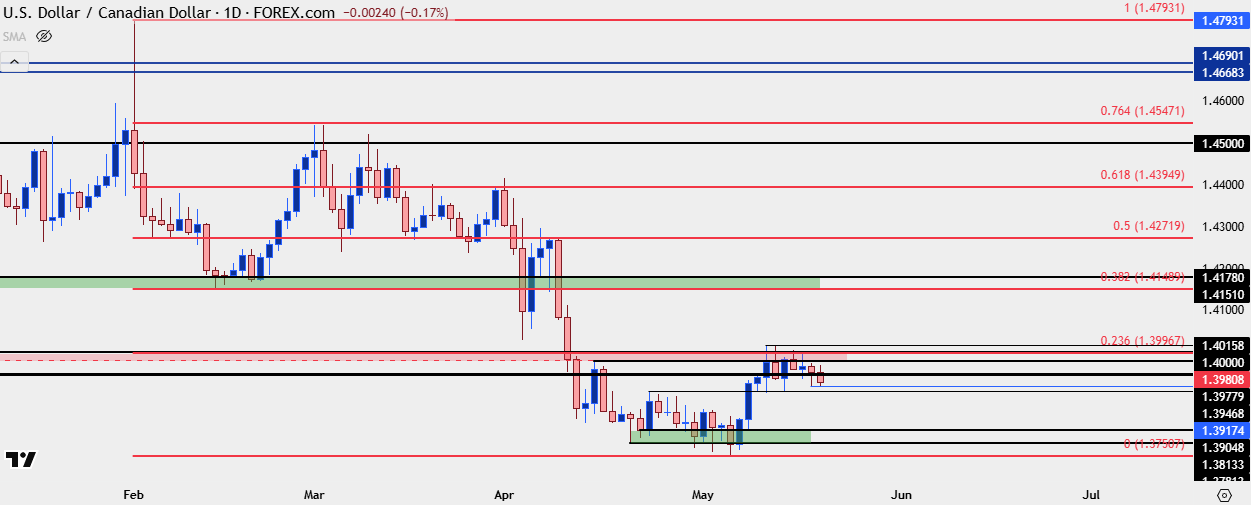 Chart prepared by James Stanley; data derived from Tradingview
USD/JPY
USD/JPY is still fighting at the 145.00 level and this pair still appears to have significant pull in larger DXY trends. Right now price is fighting around the same level that set the lows on Friday and given the Moody’s downgrade that USD bears had to chew on earlier this week, that seems to deductively be an item of strength. Nonetheless, it is a fresh low on what is now the sixth consecutive day down, and that should be respected.
As I’ve been saying, I think there’s more amenable pastures on both sides of the Yen, with EUR/JPY of attraction for Yen-strength and GBP/JPY of interest for JPY-weakness. In USD/JPY, the macro overtones are clear and if bulls can drive a reversal through the 145.92 resistance, that would be indication of USD-strength taking back over.
USD/JPY Daily Price Chart
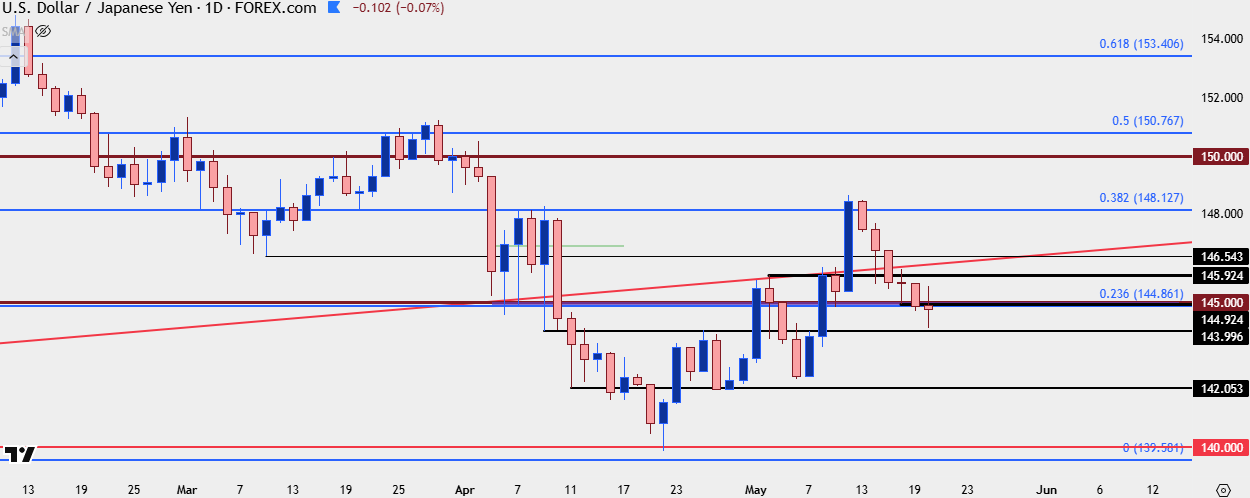 Chart prepared by James Stanley; data derived from Tradingview
Gold
Gold was a market that I spent a good amount of time on in this session as I was updating the setup from Friday. At the time, gold was showing support at a short-term higher-low, right around a key zone as taken from prior resistance in the 3150-3167 area.
That led to another push up to 3250 to start this week, and the pullback from that led to yet another higher-low after which bulls were finally able to prod a breakout.
This illustrates the structure that I was referring to on the Friday webinar and at this point, there’s now higher-low support potential around prior resistance of 3250.

Gold Four-Hour Chart
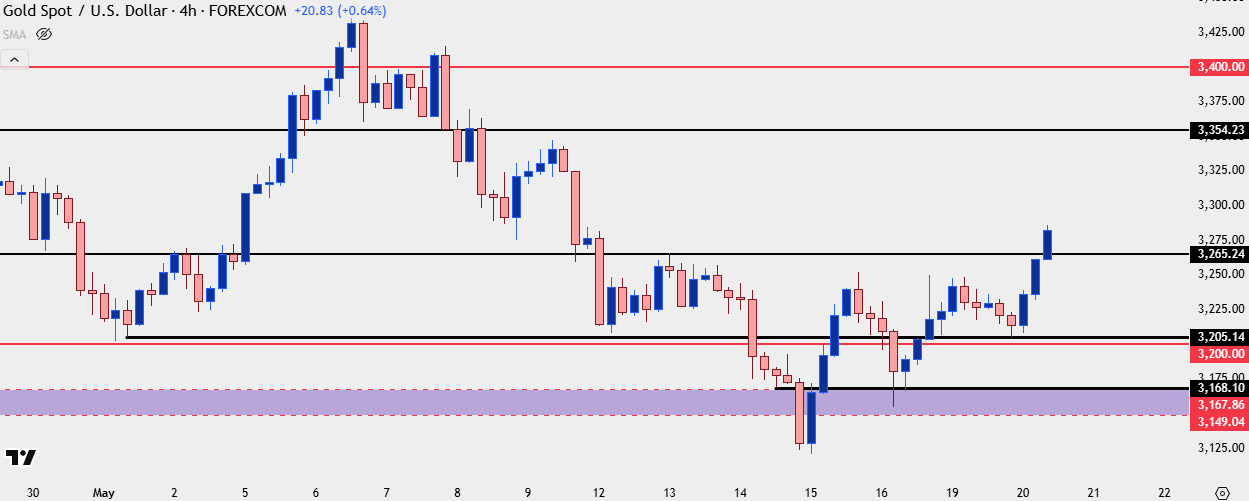 Chart prepared by James Stanley; data derived from Tradingview
--- written by James Stanley, Senior Strategist
Latest market news
September 18, 2025 02:48 PM
June 23, 2025 01:22 PM
June 23, 2025 10:39 AM
June 20, 2025 05:23 PM
June 20, 2025 04:46 PM
June 20, 2025 03:35 PM

June 17, 2025 08:37 AM

June 16, 2025 08:38 AM

June 2, 2025 08:50 AM

May 28, 2025 02:31 PM