

US Dollar Talking Points:
- The next week is loaded with USD items as tomorrow brings Core PCE and Friday NFP, with the FOMC rate decision on the calendar for the following Wednesday.
- It’s been a very bearish start to the year for the Greenback and the monthly chart shows this well, with a big spot of support coming into play to hold the lows last week.
The U.S. Dollar came into 2025 riding a strong bearish trend, but the currency topped two weeks into the New Year and the sell-off has continued ever since. Last Monday saw a big area of support come into play at 97.94, which is the 38.2% Fibonacci retracement of the 2008-2024 move, as well as being a trendline projection that had caught the lows for DXY back in July of 2023.
U.S. Dollar Monthly Chart
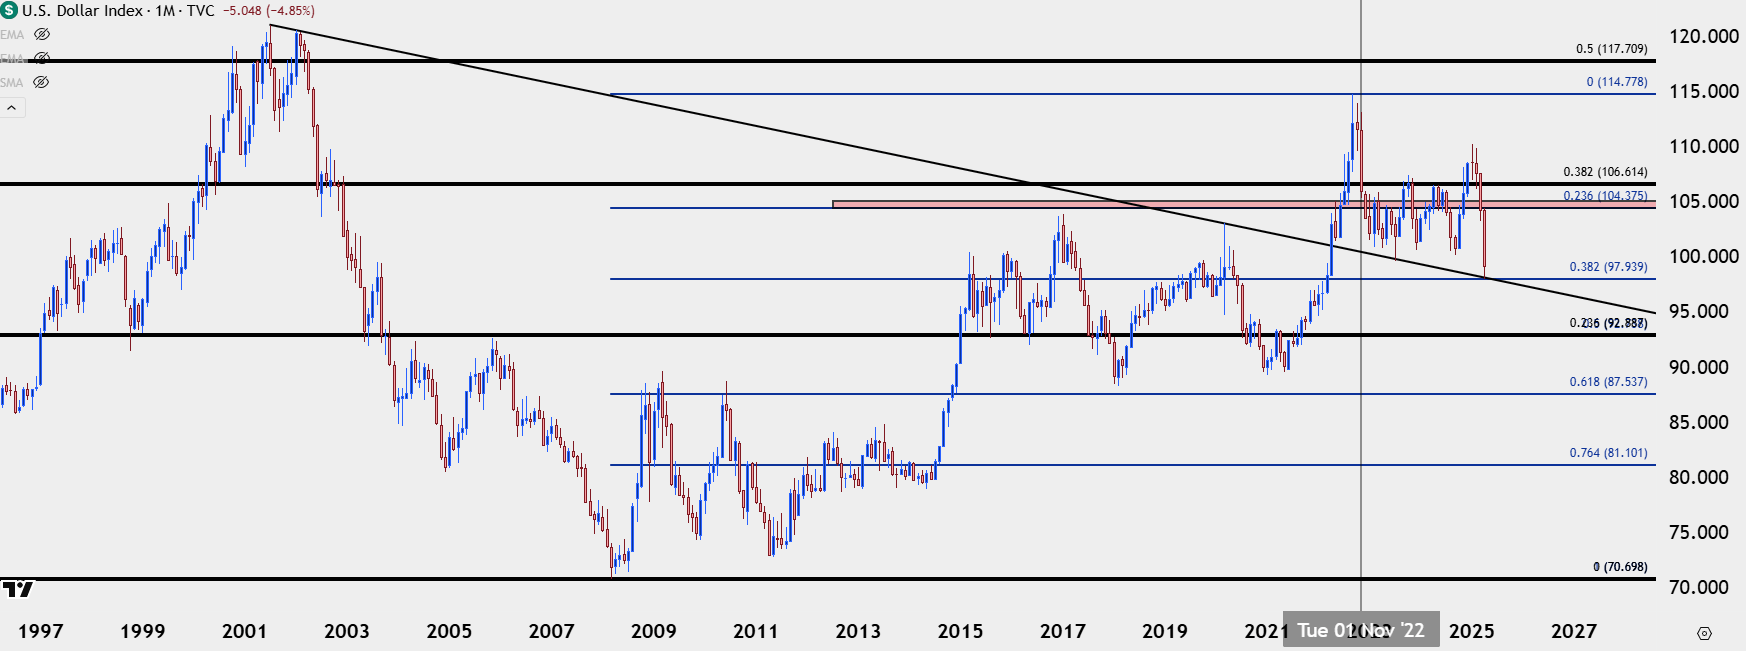 Chart prepared by James Stanley; data derived from Tradingview
USD Still Oversold
The USD remains oversold on the weekly chart and that’s a pretty rare occurrence. It doesn’t spell automatic reversal, even if it does highlight an increasingly difficult backdrop for chasing shorts to fresh lows. When RSI was last oversold on the weekly back in August of last year, sellers continued to push for another five weeks after until, eventually, a bullish reversal took over.
Given the stimuli on the calendar for the next week and a day, matters can change quickly and this is a massive spot on the chart for the US Dollar.
US Dollar Weekly Price Chart
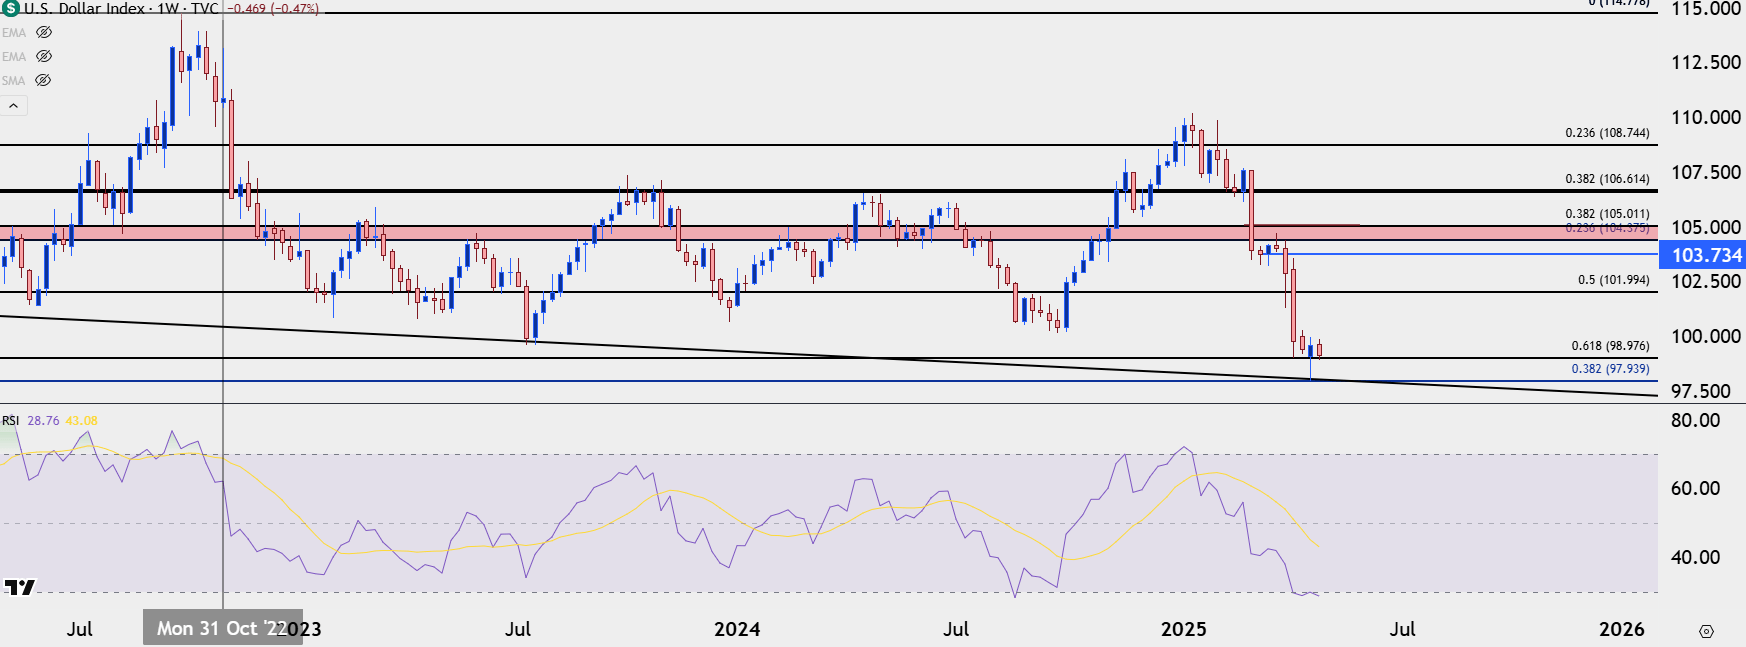 Chart prepared by James Stanley; data derived from Tradingview
EUR/USD
With the Euro playing a massive 57.6% of the DXY quote, it’s important to consider dynamics there when plotting around the USD. And for the past three weeks EUR/USD has been stalled around the 1.1400 level, with just a brief test above 1.1500 that, so far, bulls haven’t been able to overcome.
Like USD above, the weekly chart sits near an extreme with an overbought RSI read still showing. And like USD, this doesn’t mean automatic reversal, although it does illustrate a difficult area for chasing fresh highs. If we are to see a stronger bounce develop in USD it will likely need at least some help from a larger pullback in EUR/USD, with the 1.1275 and 1.1200 levels looming large as deeper supports. Also of interest on the economic calendar front is European CPI set for release on Friday morning.

EUR/USD Weekly Price Chart
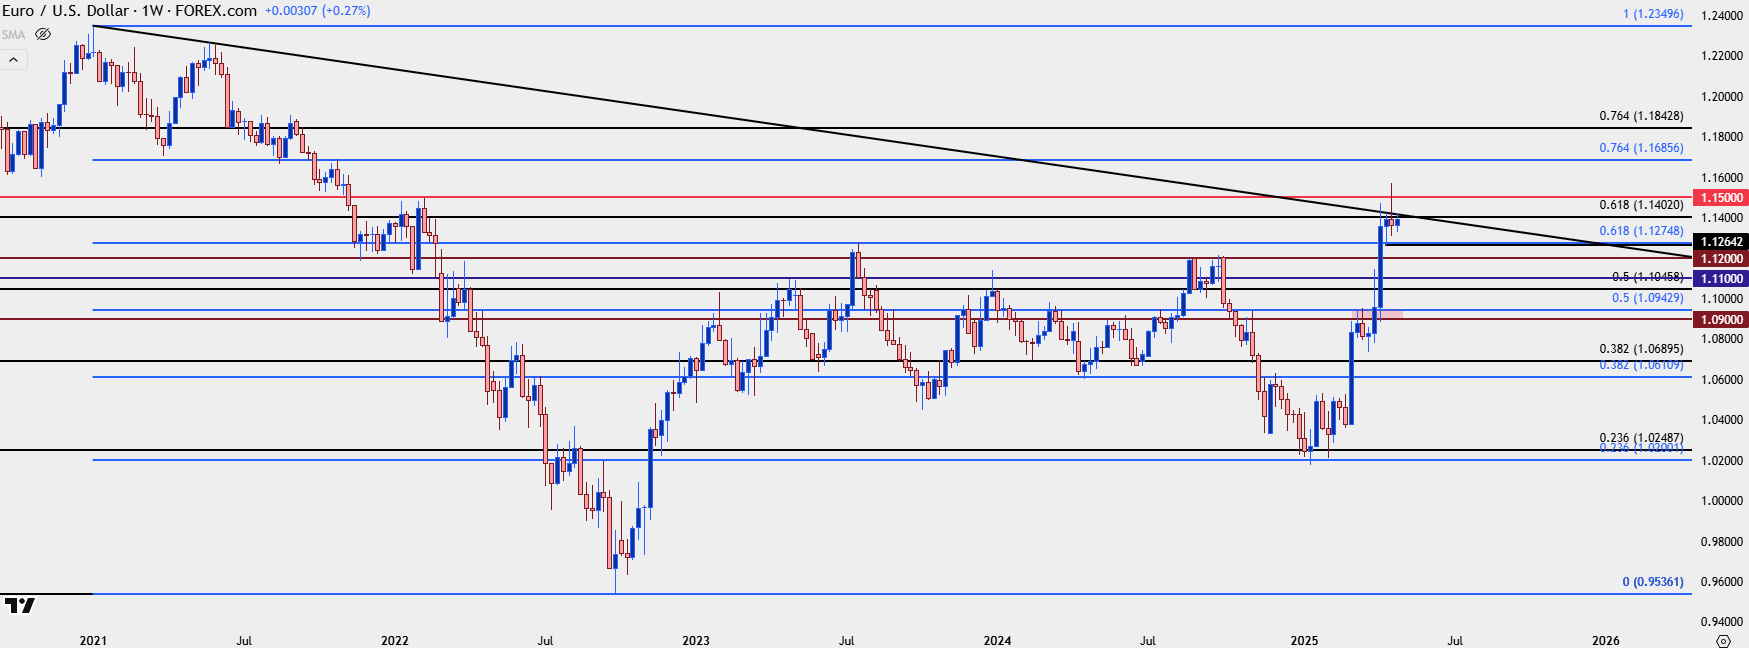 Chart prepared by James Stanley; data derived from Tradingview
USD/JPY
There’s a Bank of Japan meeting on Wednesday and while the BoJ isn’t likely to push rates amidst tariff uncertainty, they will be publishing outlooks and forecasts and that can provide a jolt to Japanese markets. The last release of that was on January 27th, and it fired a lower-low in USD/JPY that continued to spiral all the way to last week’s test of the 140.00 handle.
Bigger picture, it seems there could be more room for the pair to work lower given continued unwind of the carry trade. But – the pair has produced several bear traps already this year, even with a downtrend remaining in-force for much of the period. So caution is still required and for those looking at either Yen strength or weakness, there may be more amenable pastures elsewhere.
USD/JPY Weekly Price Chart
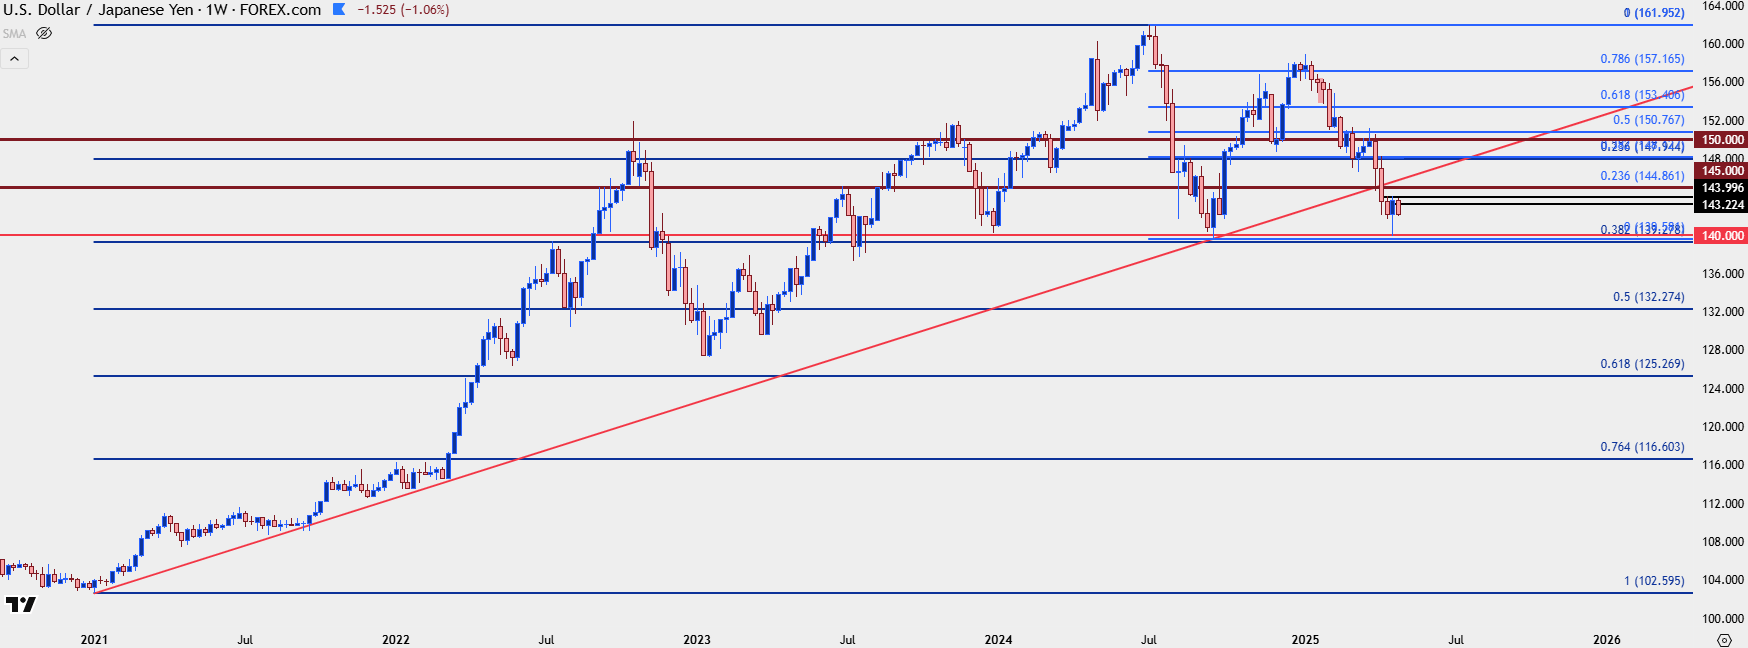 Chart prepared by James Stanley; data derived from Tradingview
USD/CAD
USD/CAD remains one of the more attractive venues for USD-weakness, in my opinion. I’ve been tracking the longer-term range that remains in-play, even after the early-February breakout. More recently the pair has seen the sell-off stall near the 1.3846 level, which was the swing high back in April of last year.
The past two weekly candles have been indecisive and so far this week, there’s a third showing something similar. In the webinar I went over a couple of different ways to work with the short side of the pair and the 1.3980-1.4000 area remains a viable spot for resistance, if a larger pullback does develop.
USD/CAD Weekly Chart
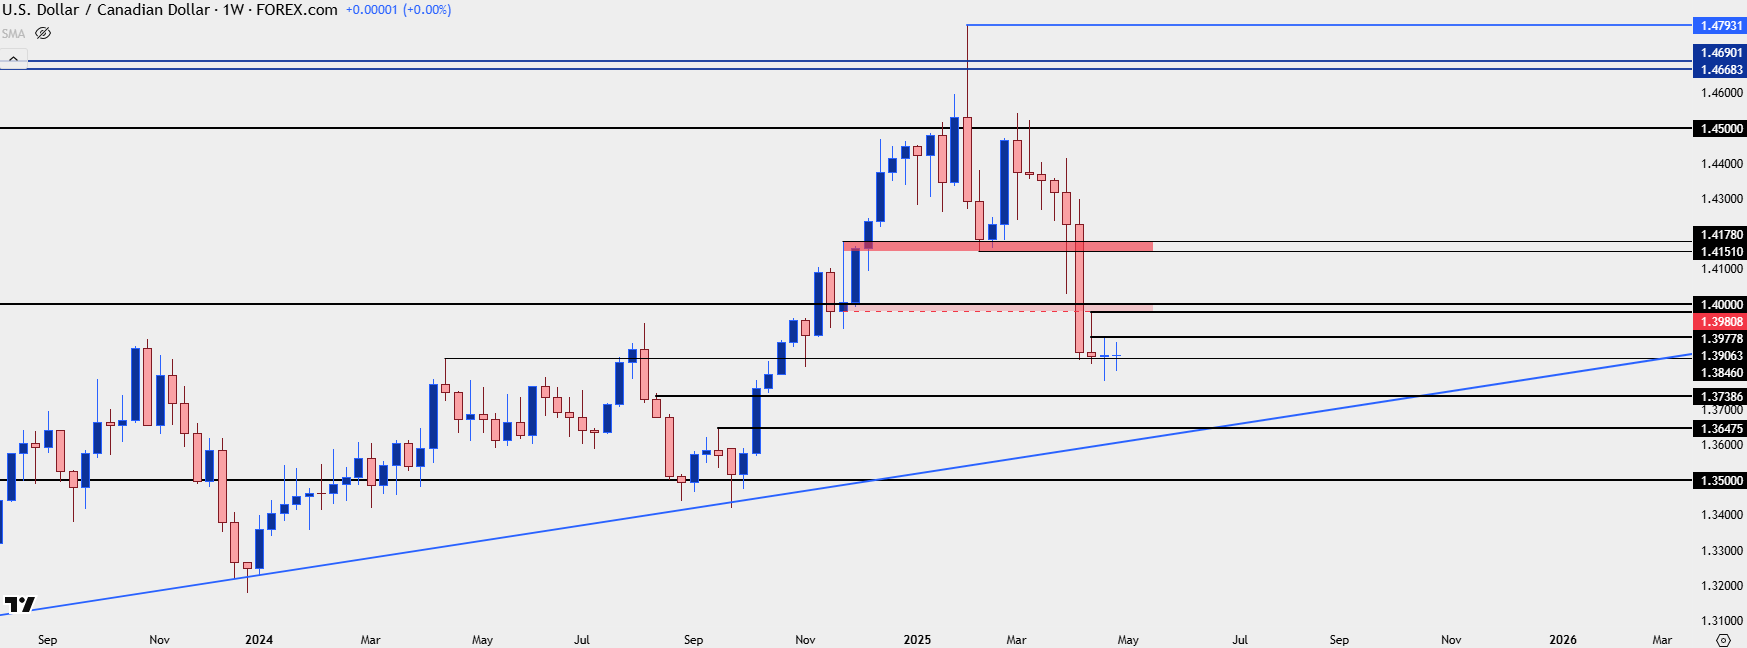 Chart prepared by James Stanley; data derived from Tradingview
--- written by James Stanley, Senior Strategist
Latest market news
September 18, 2025 02:48 PM
June 23, 2025 01:22 PM
June 23, 2025 10:39 AM
June 20, 2025 05:23 PM
June 20, 2025 04:46 PM
June 20, 2025 03:35 PM

June 20, 2025 04:46 PM

June 20, 2025 03:35 PM

June 20, 2025 02:18 PM

June 20, 2025 12:21 PM