

Over the past two trading sessions, the Canadian dollar has gained more than 1.5% against the U.S. dollar, establishing a strong short-term bullish bias. This rapid recovery has been driven in part by renewed optimism following recent trade war developments, as well as the release of U.S. CPI data earlier today. As a result, downward pressure on USD/CAD has started to consolidate in the short term.

Inflation Data Day
In the last few hours, official U.S. inflation data was released. The monthly CPI (m/m) came in at –0.1%, compared to the expected 0.1%, while the annual CPI (y/y) stood at 2.4%, slightly below the forecast of 2.5% and down from the 2.8% reported the previous month.
These figures suggest that consumer prices are finally beginning to ease in the U.S., which the market has interpreted as a potential shift in the Federal Reserve’s stance, given its 2% inflation target. Today’s softer inflation data could pressure the Fed to consider further rate cuts, which in turn would reduce demand for U.S. Treasuries and weaken the U.S. dollar, benefiting the Canadian dollar in the short term.
Nonetheless, in terms of interest rates, the U.S. continues to lead with a benchmark rate of 4.5%, compared to 2.75% in Canada, where the central bank maintains a dovish stance. Despite this, the DXY index, which tracks the U.S. dollar against a basket of currencies, has recently lost momentum—allowing the Loonie to start gaining ground against the greenback.
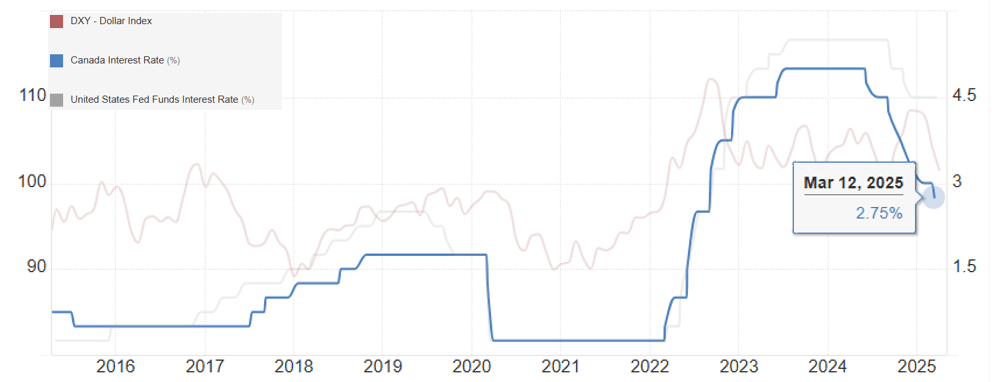
Source: Trading Economics
It’s important to remember that the interest rate differential will be crucial moving forward. If the Fed fails to incorporate this new inflation data into its upcoming decisions, the rate differential will continue to favor the U.S., potentially keeping U.S. fixed-income assets more attractive than those of Canada. In this scenario, the current USD weakness could be temporary, and buying pressure on USD/CAD could resume if the Fed maintains its current policy direction.
What’s Next in the Trade War?
Since yesterday, it has become clear that the Trump administration’s focus is to escalate the trade war with China. This is evident from its decision to raise tariffs to 125% on Chinese imports, while pausing tariffs on dozens of other previously targeted countries for 90 days.
In Canada’s case, the tariff pause does not currently apply, but this opens the door for potential negotiations to secure exemption—avoiding the 25% tariffs that could severely impact Canadian exports.
Moreover, in recent sessions, Canada managed to secure exemptions for most of its products under the USMCA, which has helped stabilize market confidence. The current expectation is that not all Canadian exports will be affected by Trump’s protectionist policies.
In this scenario, with attention shifting mainly toward China, Canada may gain room to negotiate more favorable trade terms. This has helped boost short-term optimism toward the Canadian dollar, reviving bearish momentum in USD/CAD.
However, the coming days will be crucial. Canada remains under U.S. scrutiny, and if no bilateral agreements are reached soon, economic uncertainty could return—potentially impacting the Loonie’s performance once again.
USD/CAD Technical Outlook
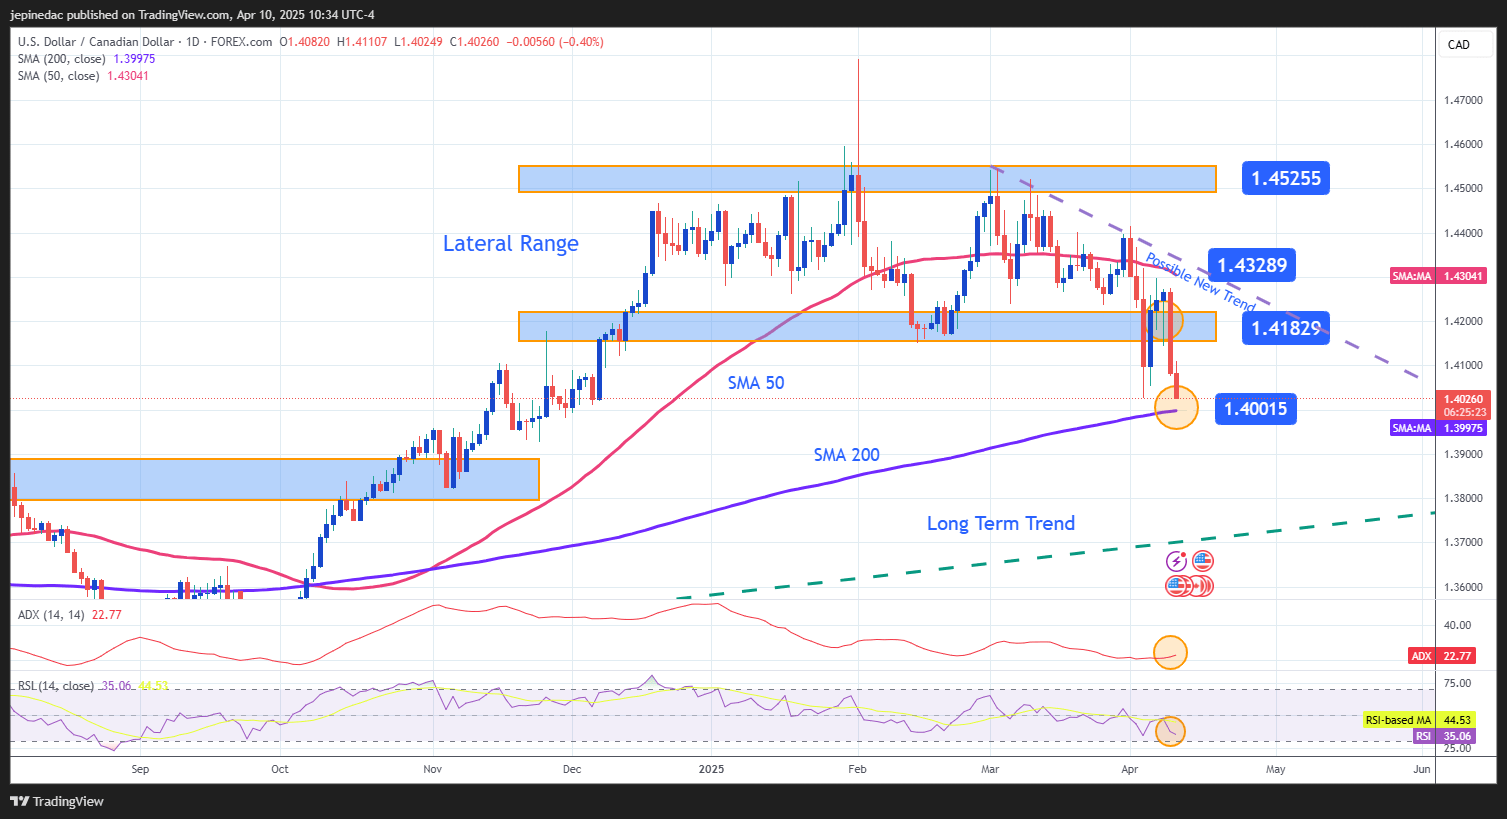
Source: StoneX, Tradingview
- Breakout of the Sideways Range: Recent selling pressure has played a pivotal role in USD/CAD price action, as the pair broke below the lower boundary of the long-standing sideways channel at 1.41829. This move opens the door for a new short-term bearish trend to develop.
Following this breakout, a new descending trendline is starting to take shape—potentially becoming the dominant structure in the upcoming sessions. However, there’s still a key support level to watch: the 200-period moving average, which could temporarily halt further selling.
- ADX: The ADX line has begun to consistently oscillate above the 20 level, indicating that bearish strength is becoming more established. As the ADX continues to rise, this suggests that momentum may strengthen in the short term.
- RSI: The RSI is showing a clear downward slope, highlighting dominance of bearish momentum in the short term. However, the line is now approaching the 30 level, which marks the oversold zone. This could indicate an imbalance due to excessive selling, opening the door to short-term bullish corrections.
Key Levels:
- 1.43289 – Distant Resistance: This level aligns with the 50-period moving average. If price returns to this zone, the former sideways channel could regain relevance.
- 1.41829 – Near Resistance: Marks the former support of the previous range, now acting as key resistance. A move back above this level would challenge the current downtrend.
- 1.40015 – Critical Support: This is the most important level, coinciding with the 200-period moving average. A break below this zone could trigger a deeper decline, consolidating a stronger bearish trend.
Written by Julian Pineda, CFA – Market Analyst
Latest market news
September 18, 2025 02:48 PM
June 23, 2025 01:22 PM
June 23, 2025 10:39 AM
June 20, 2025 05:23 PM
June 20, 2025 04:46 PM
June 20, 2025 03:35 PM

June 23, 2025 01:22 PM

June 20, 2025 01:09 PM
June 18, 2025 01:34 PM

June 17, 2025 12:50 PM