

Key Events to Watch:
- US Dollar Index (DXY) drops to 98 amid Trump threats to the Fed
- Tesla earnings on Tuesday may further fuel stock market volatility
- IMF Spring Meetings – potential signals on global trade and monetary policy
- China threatens retaliation against countries aligning with Trump’s economic stance
USDCAD Weekly Chart – Log Scale

Source: TradingView
In line with the broader weakness in the US Dollar Index (DXY), which is currently testing the key 98 support level, USDCAD is eyeing a critical confluence zone near 1.3740, supported by Fibonacci levels. This zone aligns with the 1.272 Fibonacci extension drawn from the three-wave correction since the February 2025 high, through the February 2025 low, and back to the March 2025 high.
Additionally, from a broader perspective, this area coincides with the 0.618 Fibonacci retracement of the uptrend extending from the May 2021 lows to the February 2025 highs. If the pair drops further, the next support levels to monitor are 1.3570 and 1.3400. On the upside, a recovery above 1.3740 could open the door for gains toward 1.3940, 1.4040, and 1.4140.

Nasdaq Outlook – 4H Time Frame (Log Scale)
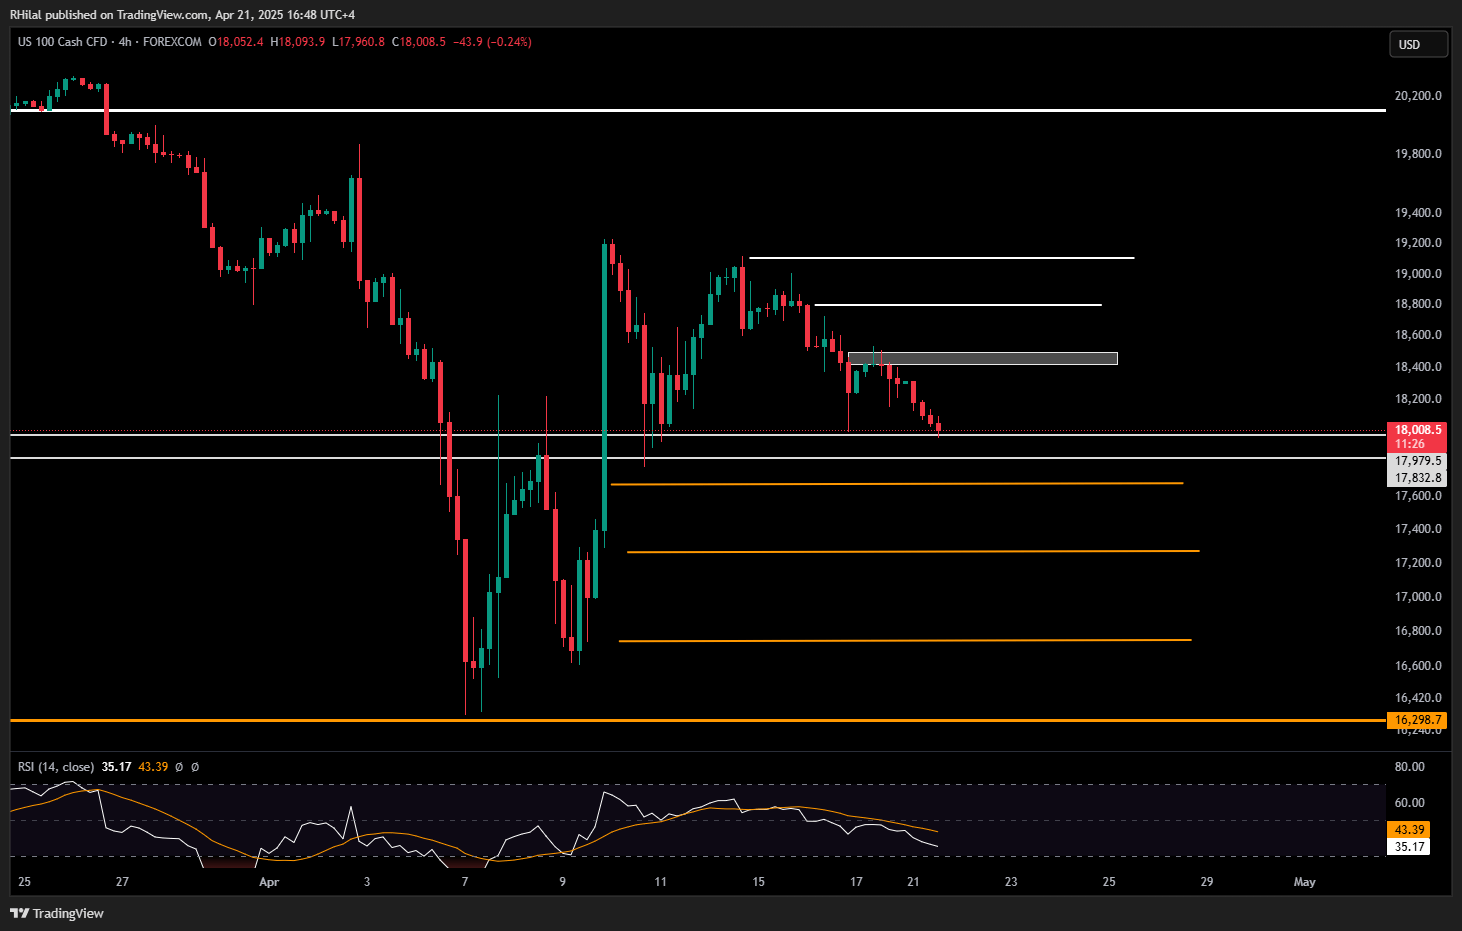
Source: TradingView
US indices are trending lower amid continued uncertainty, with the Nasdaq hovering just above 18,000. Key support zones lie between 17,900 and 17,600. A break below these levels may confirm a shift toward a more bearish structure, with potential downside targets at 17,200, 16,700, and 16,300.
In a worst-case risk scenario, a drop below 16300 may extend another 1,000-point drop towards 15,000. However, if Nasdaq holds above 18,000 and is supported by strong fundamentals, we could see a bounce toward 18,500, 18,800, and 19,200. That would bring it back to a key resistance zone, where the market must decide between resuming a broader uptrend beyond 20,000 or facing another correction.

Written by Razan Hilal, CMT
Follow on X @Rh_waves
Latest market news

April 25, 2025 09:13 AM

April 23, 2025 06:36 PM

April 21, 2025 01:06 PM

April 16, 2025 03:36 PM