Key Events:
- The DXY holds steady near 99 ahead of the ECB meeting and Easter holidays, temporarily calming fears of a continued decline in the greenback
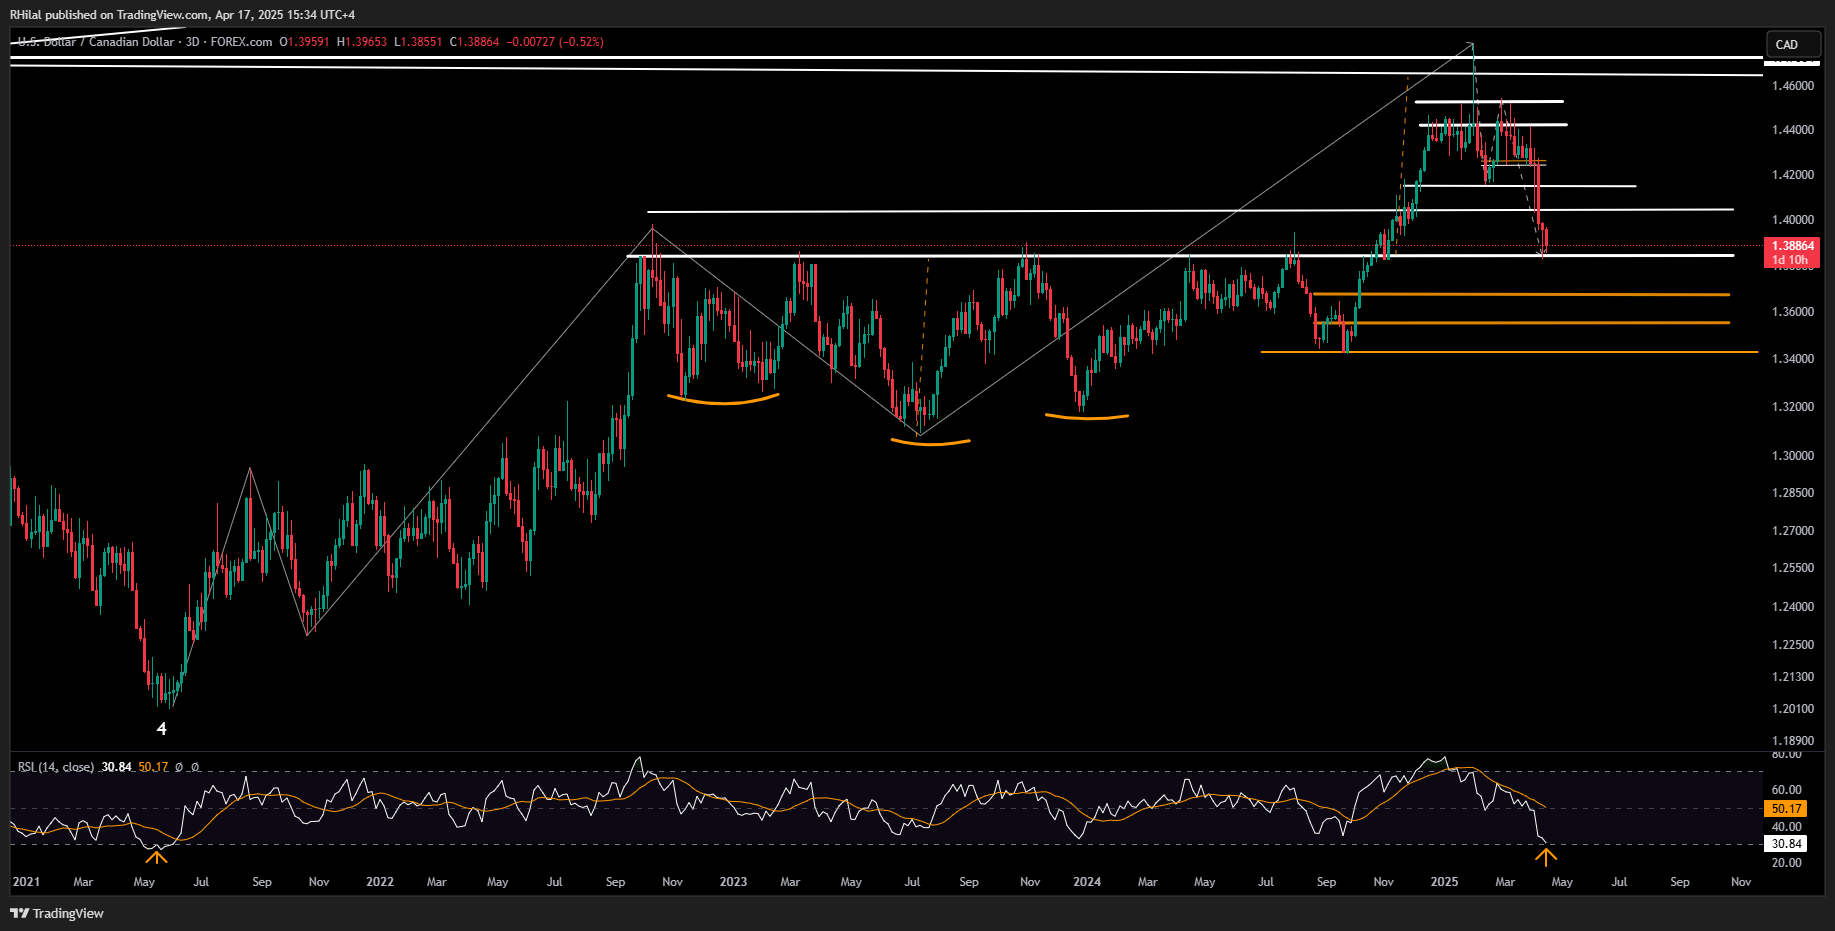
- USDCAD is holding above the 1.3820 support level, which it approached following the BoC's decision to hold rates at 2.75%
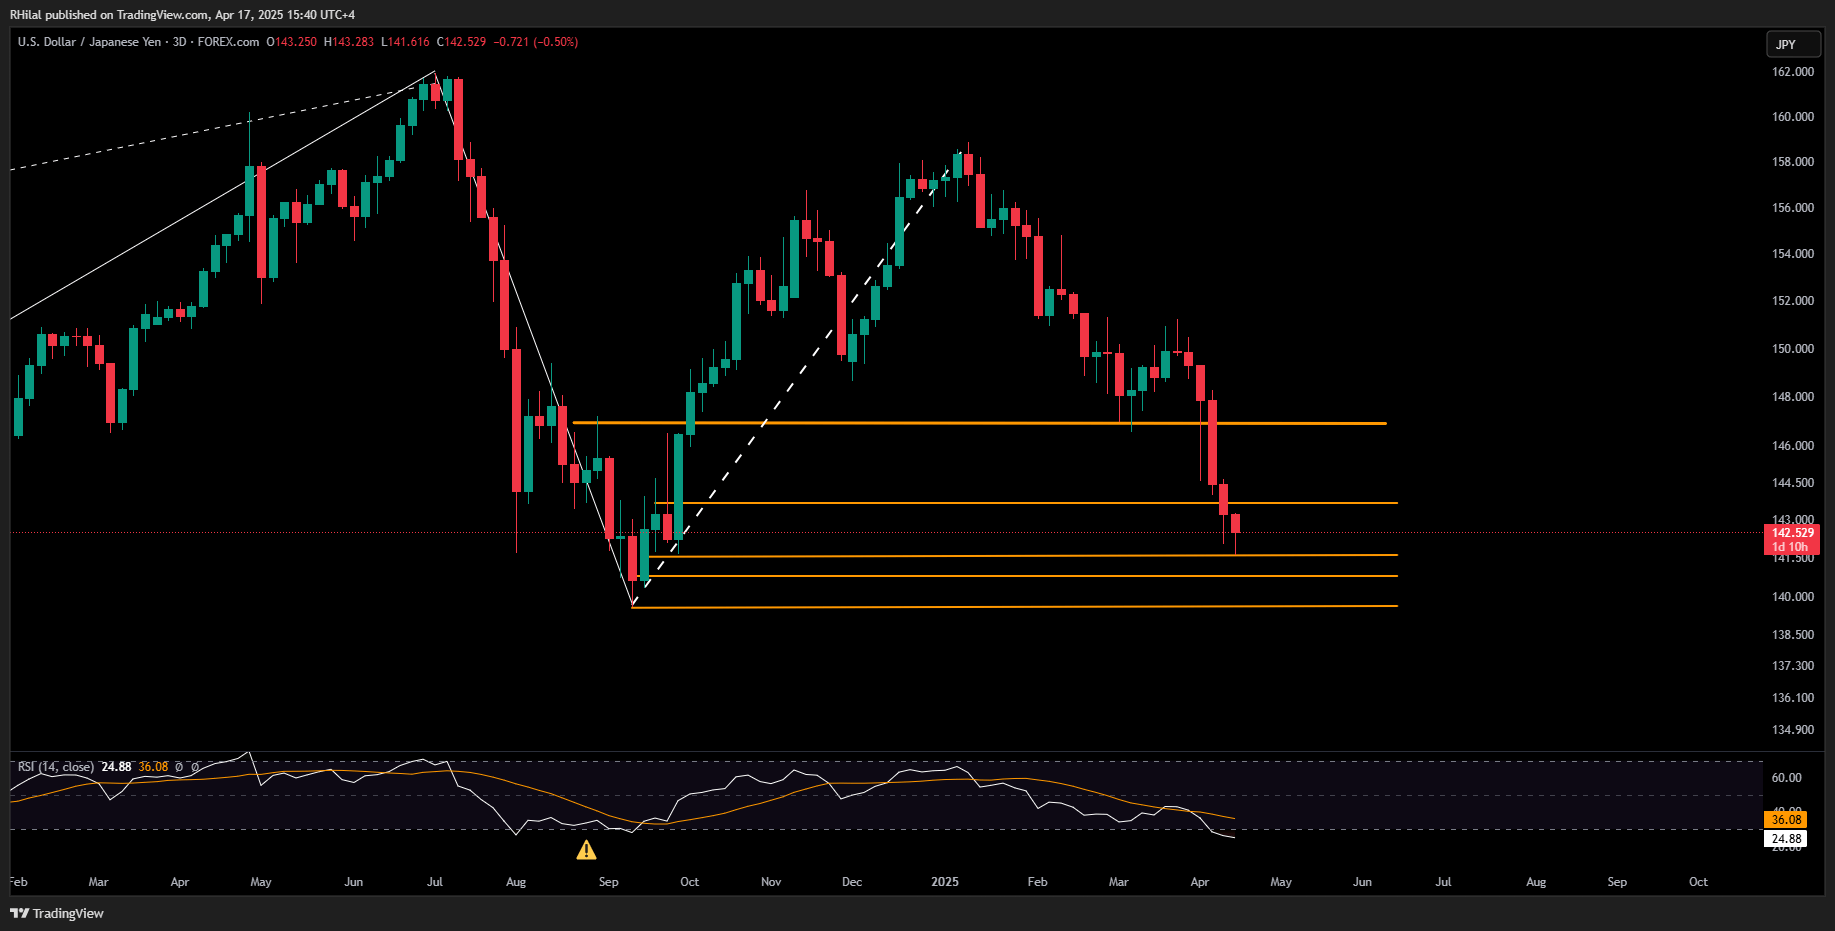
- USDJPY remains above the 141.60 support, aligned with extreme momentum conditions in safe-haven assets, increasing the risk of a reversal once the headlines shift
Ongoing tensions between the US and China have pushed safe-haven assets to extreme levels, with momentum conditions resembling those last seen in 2020. Under such conditions, any peace deal headlines between the world’s largest economies may sharply reverse current trends — potentially triggering a bullish bounce in the US Dollar Index (DXY) and a negative reversal in gold, the Swiss franc, and the Japanese yen.
For now, risks remain elevated. Should they persist and drive the DXY below 98, the market may accelerate in the direction of existing momentum.
USDCAD Outlook
Following softer Canadian CPI data, the Bank of Canada held interest rates steady at 2.75%, sending USDCAD toward the 1.3820 support level — an area that aligns with the November 2024 lows and a key resistance zone extending back to the highs of September 2022.
This zone marks a strong reversal region as momentum dips to its lowest levels since 2021, when the pair traded near 1.20. A successful hold here may open the door for a rebound; otherwise, a deeper drop could unfold across 2025.
USDJPY Outlook
While the BoC adopts a hold stance amid easing inflation and a stronger Canadian dollar, and the ECB leans toward rate cuts due to euro strength and growth risks, the BoJ is also expected to hold rates. This cautious approach comes in response to weakening export data and the broader trade war environment.
The yen has gained notable strength, now just two support levels above its September 2024 low of 139.60. For now, the trend holds above the 141.60 support, coinciding with key Fibonacci retracement levels of the uptrend from September 2024 to January 2025.
Technical Analysis: Quantifying Uncertainties
USDCAD Forecast – 3-Day Time Frame (Log Scale)

(Source: TradingView)
USDCAD is hovering above a two-year resistance zone that extended from October 2022 to October 2024, which was first breached in that period. The 1.3820 low aligns with the 0.272 Fibonacci retracement of the uptrend from May 2021 to January 2025. This support also coincides with RSI levels not seen since 2021.
A sustained hold and reversal from this zone may push the pair toward 1.4040, 1.4150, 1.4240, and eventually 1.4400. On the downside, a firm break below 1.3820 could open losses toward 1.3670, 1.3560, and 1.3430.
USDJPY Forecast – 3-Day Time Frame (Log Scale)

(Source: TradingView)
The USDJPY has been retracing within a well-defined Fibonacci structure from the September 2024 lows to the January 2025 highs. The latest support lies at 141.60. A drop below could extend the move toward 140.00 or even 139.60 — the September 2024 low.
However, a reversal from here could retest 143.60 and 146.90 — former support zones now acting as resistance. A clear break and hold above 146.90 would improve the bullish outlook toward 149.00 and potentially 151.00. Conversely, a breakdown below 139.60 could trigger a more aggressive bearish trend into 2025.
Written by Razan Hilal, CMT
Follow on X: @Rh_waves


