

Key Events
- US Imposes 104% Tariffs on China, dragging US indices and the Dollar near yearly lows
- US CPI (Friday) will be closely watched to assess the inflationary impact of tariffs
- Bank Earnings and US Consumer Sentiment (Friday) to offer insights into broader economic consequences of trade tensions
World’s Largest Economies Escalate Trade War
China intensified its response to US tariffs by imposing 84% levies of its own, vowing to "fight until its last breath." This escalation followed Trump’s 104% tariff move and sent oil plunging towards $55 per barrel — a new yearly low. Market sentiment remains fragile, with US indices and the US Dollar hovering near critical support zones ahead of Thursday’s CPI data and Friday’s key earnings and sentiment reports. s
Major Currency Pairs Hold Ground Near September 2024 Peaks and Lows
The US Dollar Index (DXY) is nearing a key support zone at the 100 level, which has held since 2023. A break below could trigger a significant trend reversal or accelerate the dollar’s weakness. In parallel, the USDJPY is approaching limited support before the 2024 trough near the 140 barrier. The pair is trading cautiously as investors await clarity from inflation data, monetary policy signals, and fresh trade war headlines.
Volatility Outlook: VIX Holds Below 2020 Highs

Source: Tradingview
The CBOE Volatility Index (VIX) remains below its 2020 highs. Notably, the monthly RSI has entered overbought territory — levels last seen in 2020 — suggesting the potential for a short-lived bout of market weakness or possibly a final spike before a broader trend reversal takes hold.
Technical Analysis: Quantifying Uncertainties
USDJPY Forecast: 3-Day Time Frame – Log Scale
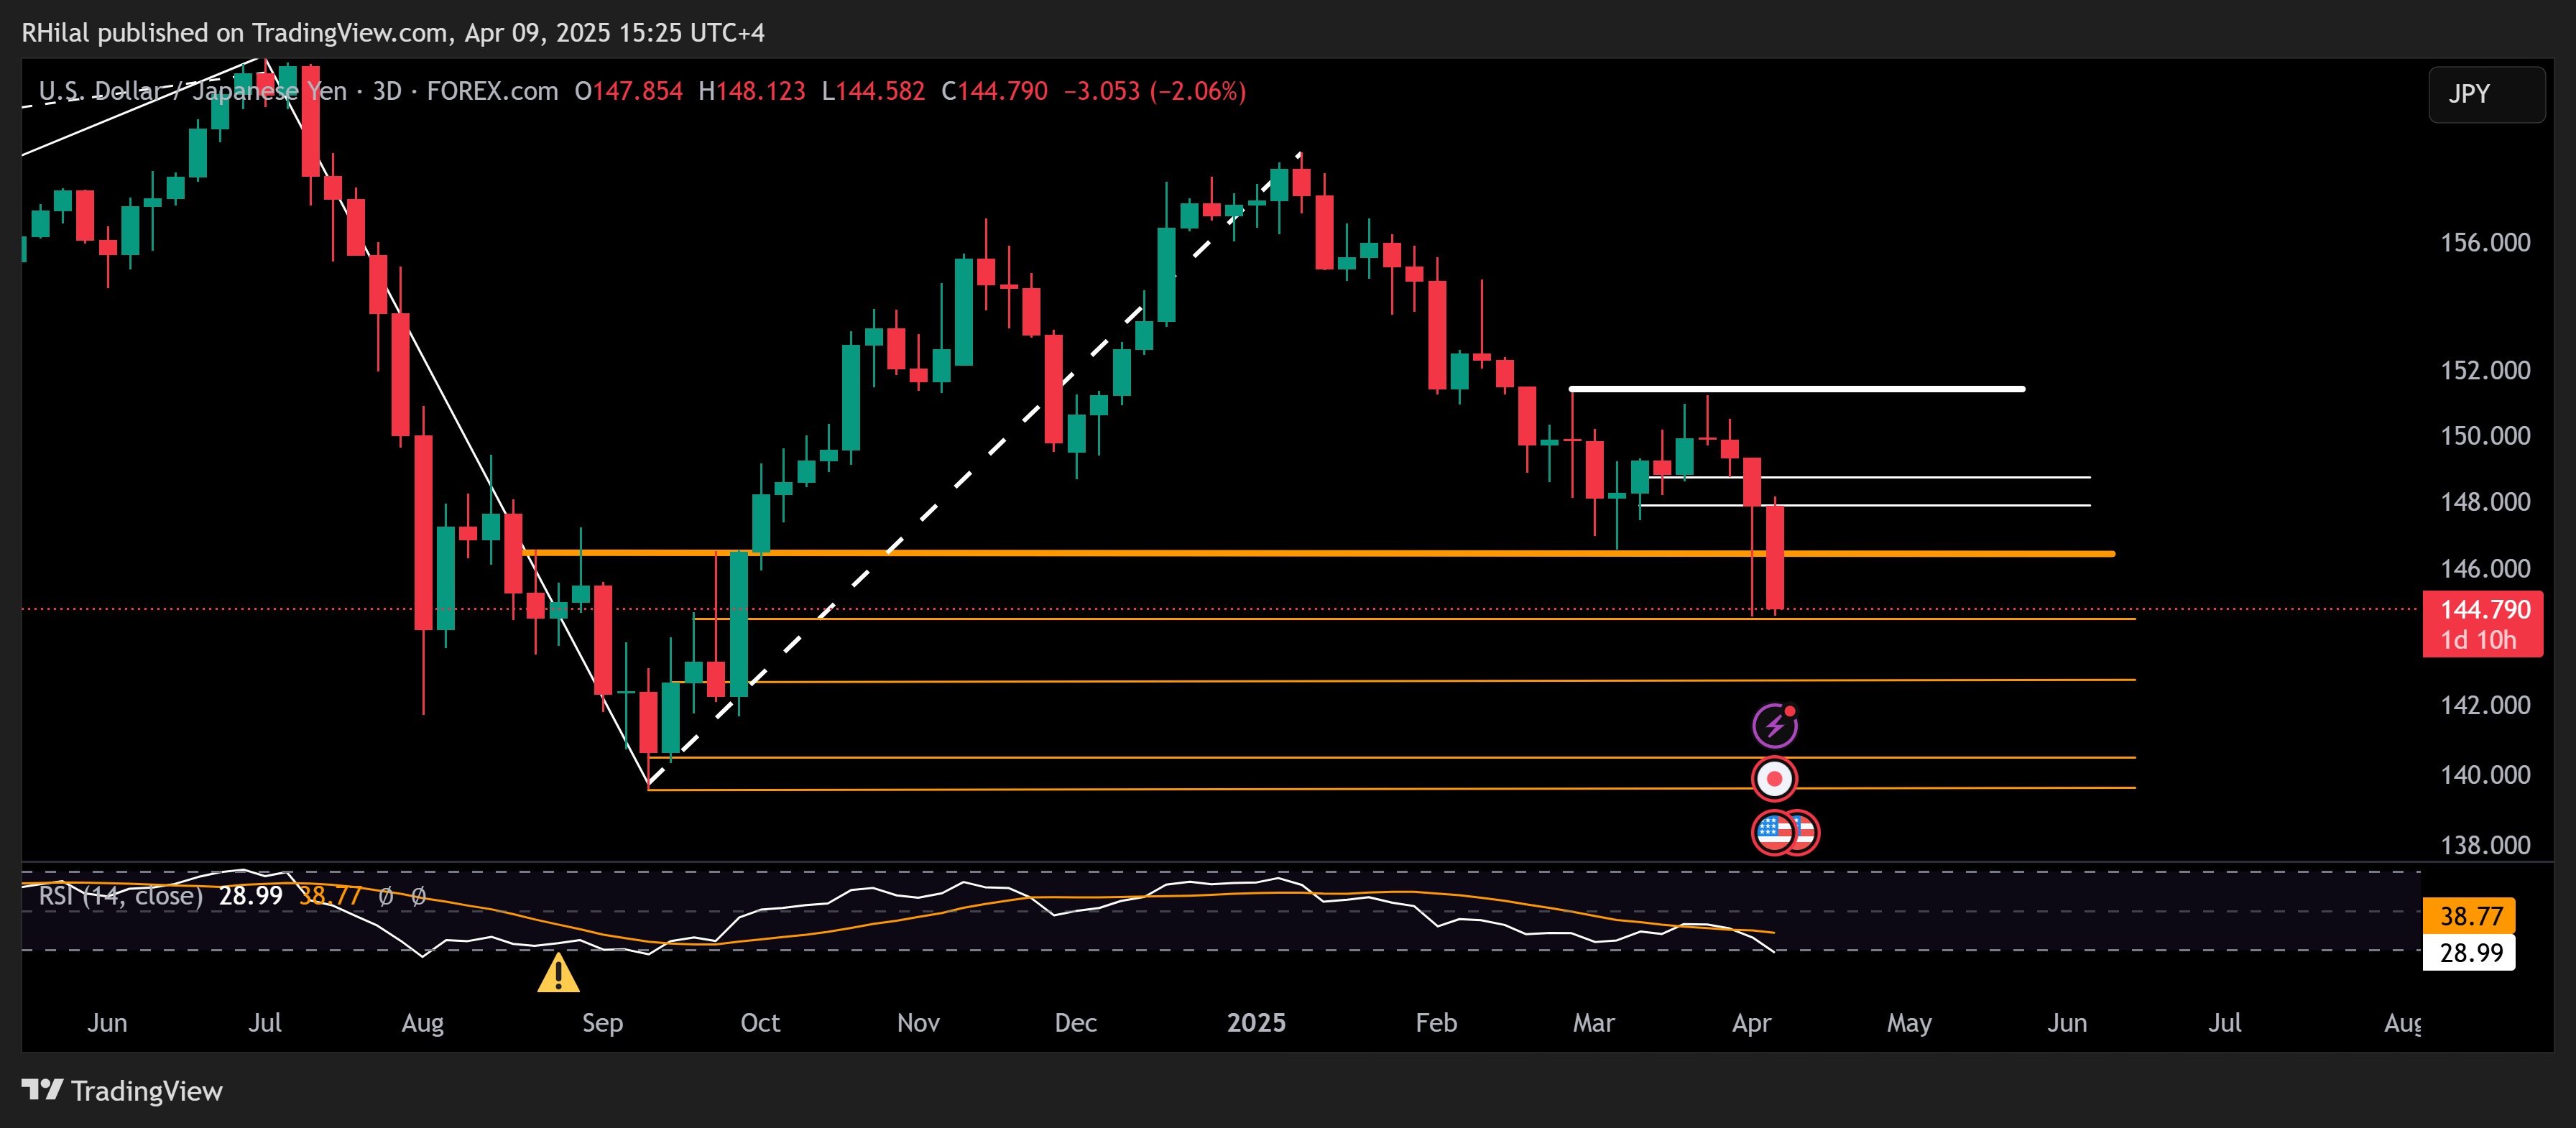
Source: Tradingview
The yen mirrors the dollar’s broader weakness, with USDJPY holding just above the 144.50 support level. A break below this threshold could expose further downside towards 2024 lows, with potential support at 142.70, 140.50, and 139.60. If the 144.50 level holds, upside targets include 146.50, 147.80, 148.70, and possibly 151.30.
Dow Forecast: Weekly Time Frame – Log Scale
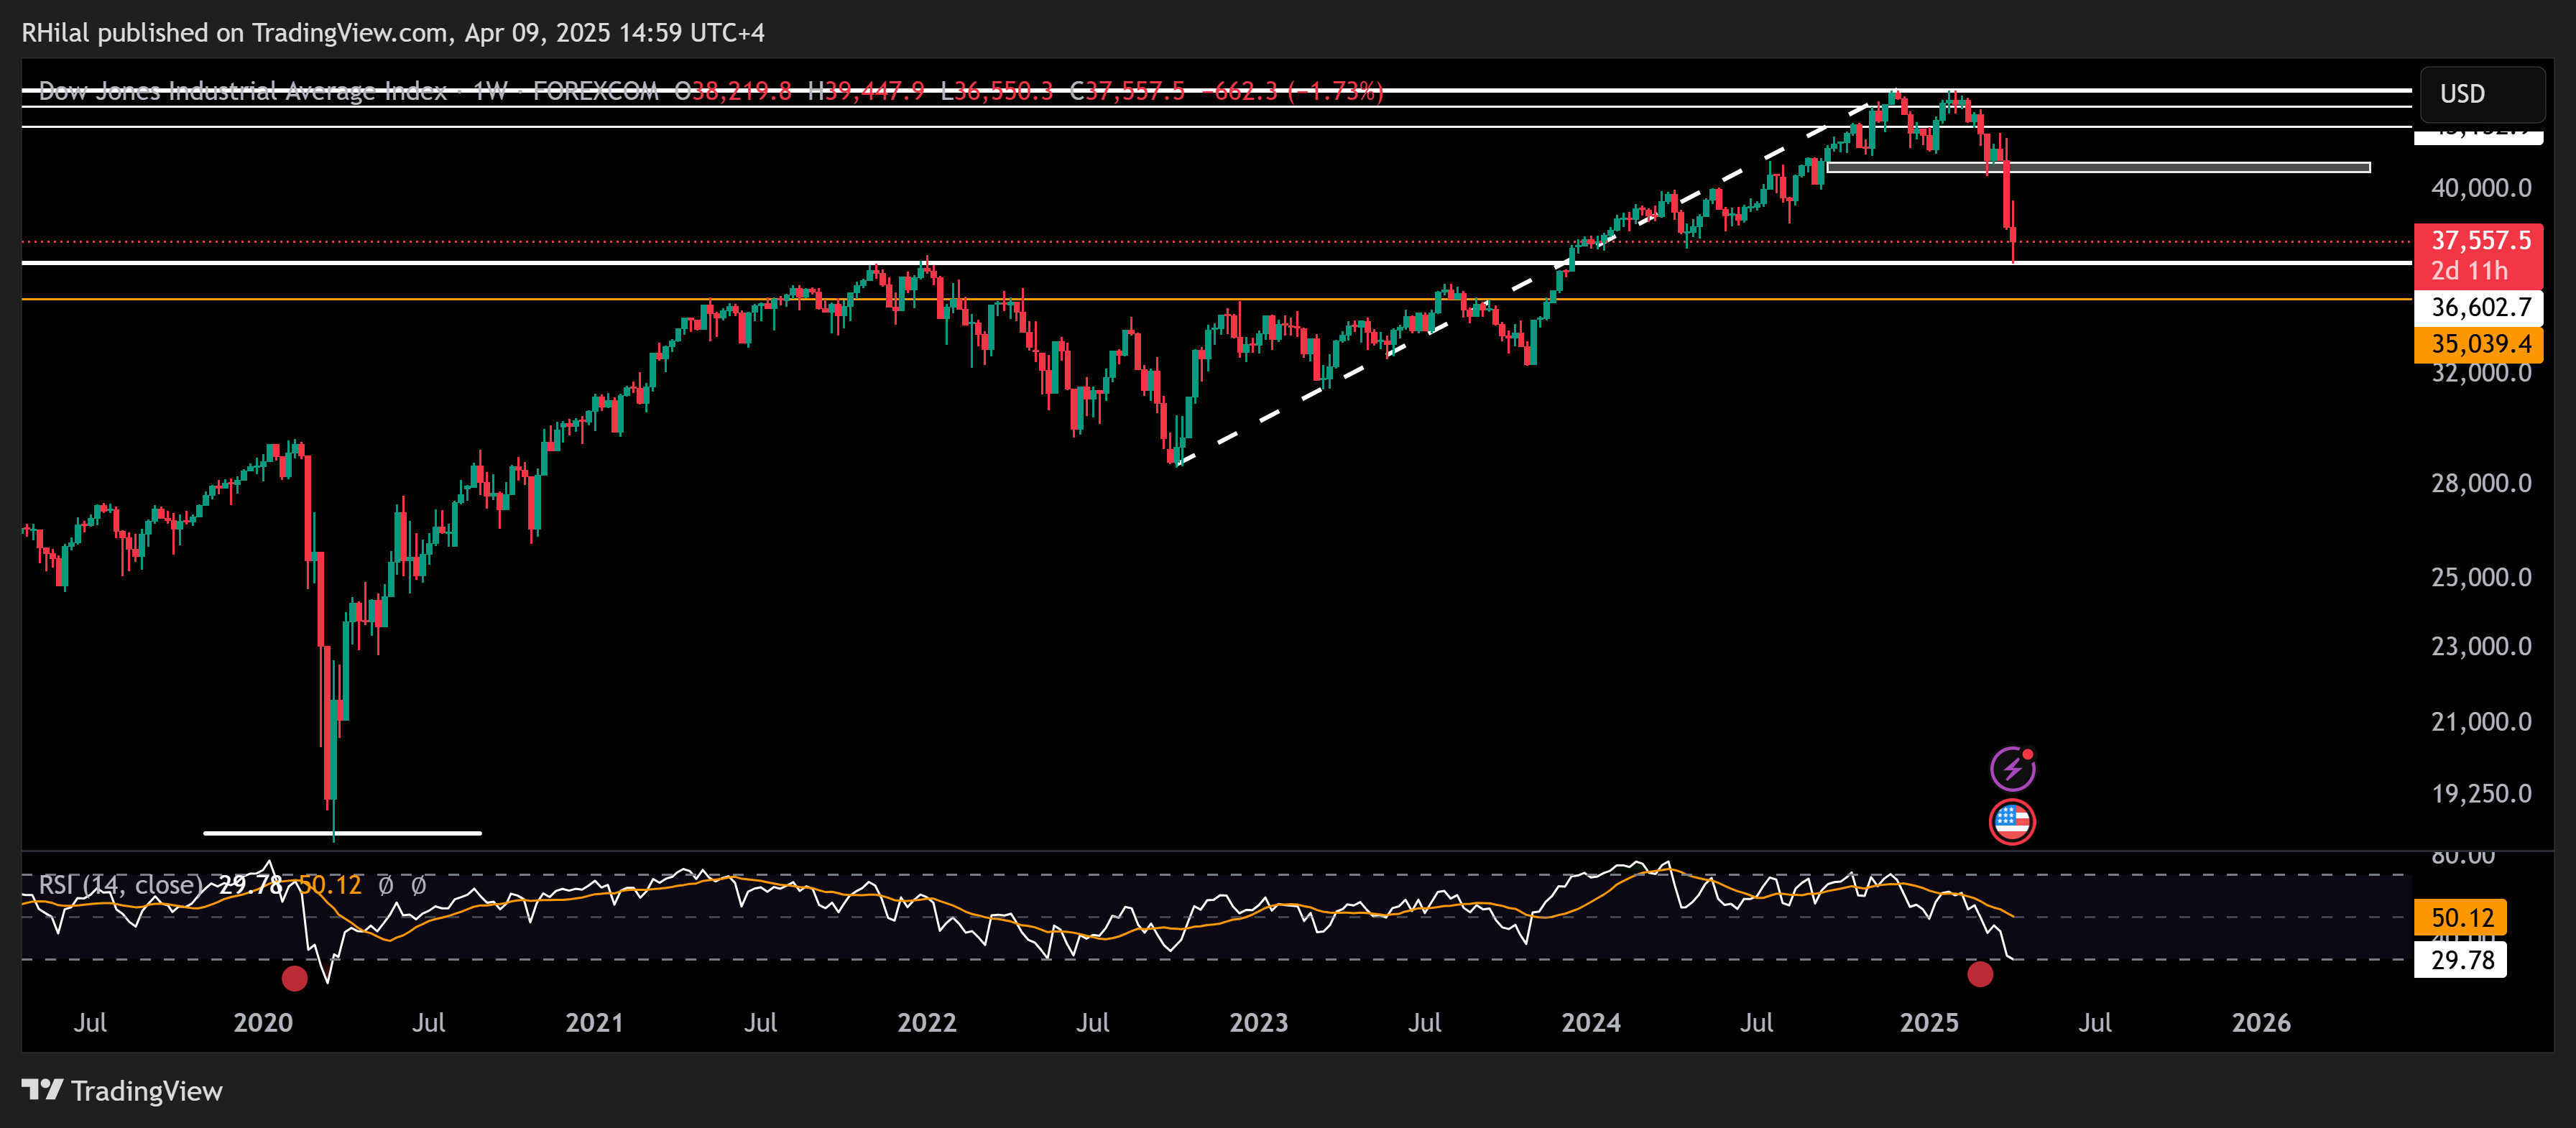
Source: Tradingview
The Dow is attempting a rebound from its 2021 highs, aligning with RSI levels last seen during the 2020 lows. The index is currently above the 50% Fibonacci retracement level of the October 2022–2025 uptrend, around 36,500. If this support holds, the Dow could retest 40,000, 41,000, and 43,200 before making a move toward record highs. However, should turbulence persist, a break below 36,500 could send the Dow down to 35,000 — in line with the 61.8% retracement level.
Written by Razan Hilal, CMT
Follow on X: @Rh_waves
Latest market news

April 25, 2025 09:13 AM

April 10, 2025 10:20 AM

April 7, 2025 09:40 AM

March 27, 2025 09:25 AM