

US Dollar Outlook: USD/JPY
USD/JPY defends the monthly low (142.05) to keep the Relative Strength Index (RSI) above 30, but the exchange rate may track the negative slope in the 50-Day SMA (149.22) as it holds below the moving average.
USD/JPY Defends Monthly Low to Keep RSI Above 30 for Now
Keep in mind, USD/JPY cleared the October low (142.97) even as US President Donald Trump paused the reciprocal tariffs for 90 days, and the exchange rate may attempt to test the 2024 low (139.58) as the shift in US trade policy raises the threat of a recession.
Join David Song for the Weekly Fundamental Market Outlook webinar.
David provides a market overview and takes questions in real-time. Register Here
In turn, the Federal Open Market Committee (FOMC) may stay on track to implement lower interest rates as Governor Christopher Waller emphasizes that ‘I expect the inflationary effects of higher tariffs to be temporary’ while speaking at the Certified Financial Analysts Society of St. Louis.
Governor Waller goes on to say that ‘while I expect the inflationary effects of higher tariffs to be temporary, their effects on output and employment could be longer-lasting,’ and the comments suggest the Federal Reserve will further unwind its restrictive policy in an effort to avoid a recession.
US Economic Calendar
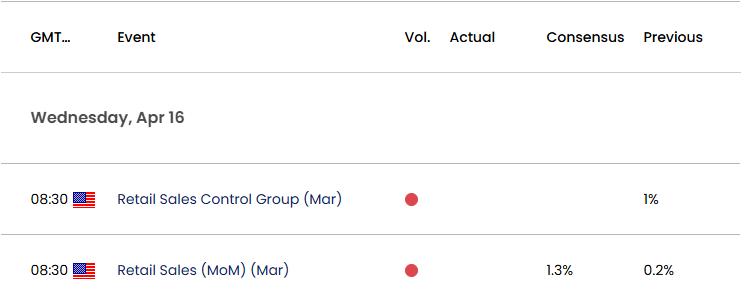
Nevertheless, the update to the US Retail Sales report may keep the Fed on the sidelines as household spending is projected to increase 1.3% in March, and signs of a resilient economy may generate a bullish reaction in the Greenback as it encourages the FOMC to retain the current policy at its next rate decision on May 7.
At the same time, a weaker-than-expected Retail Sales report may drag on the US Dollar as it fuels speculation for a looming Fed rate-cut, and a decline in USD/JPY may push the Relative Strength Index (RSI) into oversold territory for the first time in 2025.
With that said, USD/JPY may attempt to test the 2024 low (139.58) as it appears to be tracking the negative slope in the 50-Day SMA (149.22), but the exchange rate may consolidate over the remainder of the week should it continue to defend the monthly low (142.05).
USD/JPY Price Chart – Daily
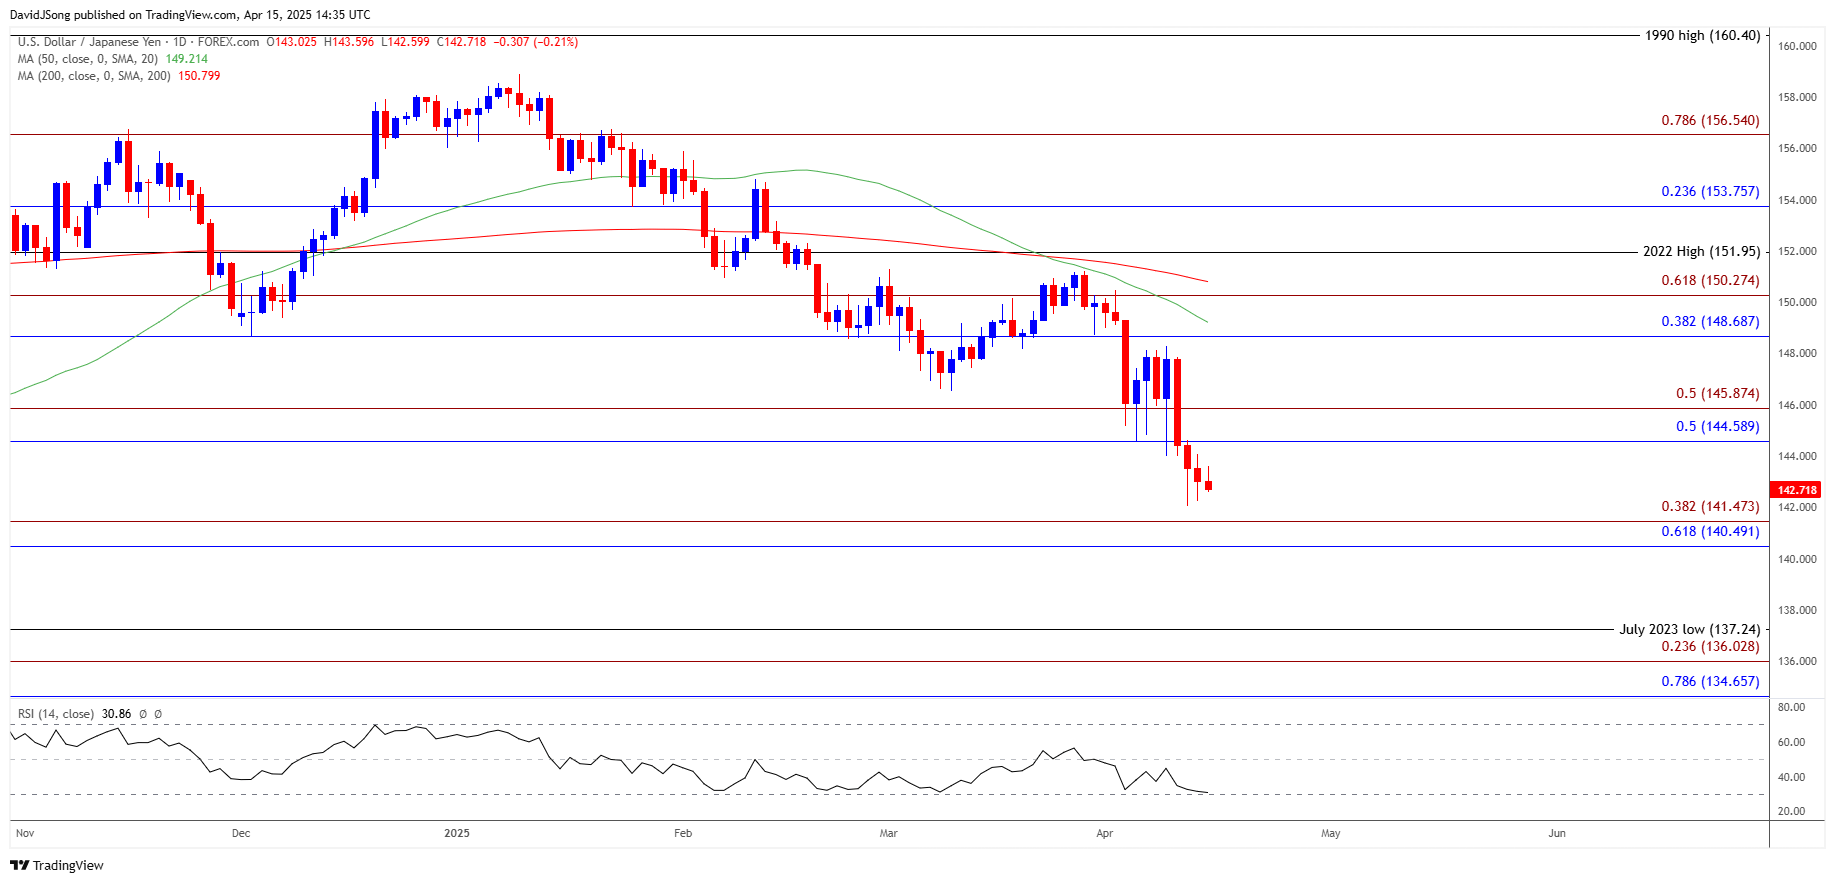
Chart Prepared by David Song, Senior Strategist; USD/JPY on TradingView
- USD/JPY appears to be defending the monthly low (142.05) as it trades in a narrow range, with a move/close above the 144.60 (50% Fibonacci retracement) to 145.90 (50% Fibonacci extension) region raising the scope for a move towards the 148.70 (38.2% Fibonacci retracement) to 150.30 (61.8% Fibonacci extension) zone.
- Next area of interest comes in around the monthly high (150.49), but failure to defend the monthly low (142.05) may push USD/JPY towards the 140.50 (61.8% Fibonacci retracement) to 141.50 (38.2% Fibonacci extension) area.
- A breach below the 2024 low (139.58) opens up the July 2023 low (137.24), with the next area of interest coming in around 134.70 (78.6% Fibonacci extension) to 136.00 (23.6% Fibonacci extension).
Additional Market Outlooks
AUD/USD Stages Four-Day Rally to Eye Monthly High
Canadian Dollar Forecast: USD/CAD Faces BoC Meeting Ahead of Canada Election
Euro Forecast: EUR/USD Clears 2024 High to Push RSI into Overbought Zone
GBP/USD Reverses Ahead of March Low to Stage Three-Day Rally
--- Written by David Song, Senior Strategist
Follow on Twitter at @DavidJSong

Latest market news
September 18, 2025 02:48 PM
June 23, 2025 01:22 PM
June 23, 2025 10:39 AM
June 20, 2025 05:23 PM
June 20, 2025 04:46 PM
June 20, 2025 03:35 PM

June 20, 2025 05:20 AM
June 20, 2025 04:38 AM

June 20, 2025 12:39 AM

June 19, 2025 11:09 PM