

US Dollar Outlook: USD/JPY
USD/JPY appears to be pulling back ahead of the 50-Day SMA (146.34) as it falls from a fresh monthly high (146.19), but the exchange rate may no longer respond to the negative slope in the moving average should it trade above the indicator for the first time since February.
USD/JPY Falls from Fresh Monthly High to Hold Below 50-Day SMA
USD/JPY struggles to extend the advance following the Federal Reserve interest rate decision even as US President Donald Trump states that ‘many trade deals in the hopper,’ and the exchange rate may give back the rebound from the rebound from the monthly low (142.36) should it snap the recent series of higher highs and lows.
Join David Song for the Weekly Fundamental Market Outlook webinar.
David provides a market overview and takes questions in real-time. Register Here
In turn, the recent recovery in USD/JPY may turn out to be temporary as the Fed keeps the door open to further unwind its restrictive policy, but data prints coming out of the US may keep the exchange rate afloat as the update to the Consumer Price Index (CPI) is anticipated to show sticky inflation.
US Economic Calendar

The US CPI is expected to hold steady at 2.4% per annum in April, and signs of persistent price growth may generate a bullish reaction in the Greenback as it encourages the Federal Open Market Committee (FOMC) to keep US interest rates on hold.
In turn, USD/JPY may attempt to further retrace the decline from the April high (150.49) as Fed Chairman Jerome Powell insists that ‘we are well positioned to wait for greater clarity before considering any adjustments to our policy stance,’ but a lower-than-expected CPI print may drag on the US Dollar as it fuels speculation for lower US interest rates.
With that said, USD/JPY may track the negative slope in the 50-Day SMA (146.34) as it pulls back ahead of the moving average, but the exchange rate may extend the recent series of higher highs and lows should it defend the advance following the Fed rate decision.
USD/JPY Price Chart – Daily
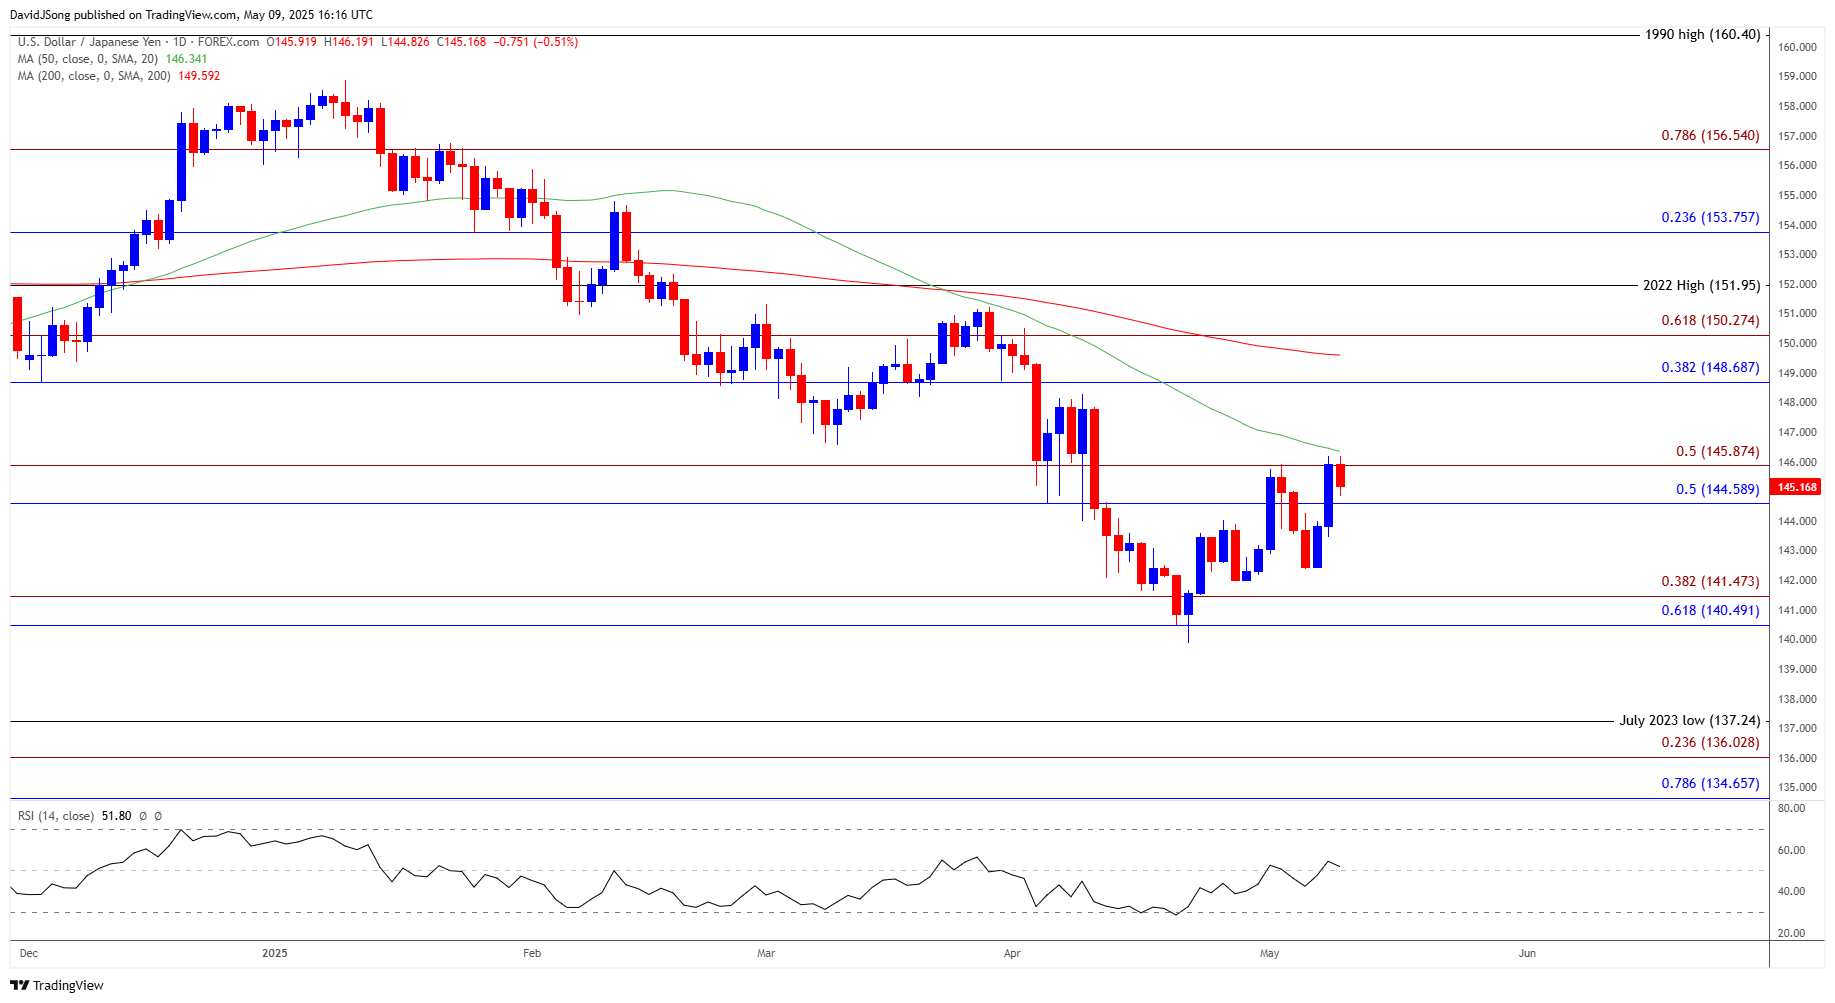
Chart Prepared by David Song, Senior Strategist; USD/JPY on TradingView
- USD/JPY may track the negative slope in the 50-Day SMA (146.34) as it pulls back ahead of the moving average, and the exchange rate may give back the advance from the monthly low (142.36) if it fails to hold above the 144.60 (50% Fibonacci retracement) to 145.90 (50% Fibonacci extension) region.
- A breach below the 140.50 (61.8% Fibonacci retracement) to 141.50 (38.2% Fibonacci extension) zone may lead to a test of the yearly low (139.89), with the next area of interest coming in around the 2024 low (139.58).
- At the same time, USD/JPY may extend the recent series of higher highs and lows should it defend the 144.60 (50% Fibonacci retracement) to 145.90 (50% Fibonacci extension) region, with a push above the moving average bringing the 148.70 (38.2% Fibonacci retracement) to 150.30 (61.8% Fibonacci extension) zone on the radar.
Additional Market Outlooks
Gold Price Weakness Keeps RSI Out of Overbought Territory
GBP/USD Post-BoE Rebound Unravels amid US-UK Trade Deal
Australian Dollar Forecast: AUD/USD Threatens December High
Canadian Dollar Forecast: USD/CAD Reverses Ahead of Monthly High
--- Written by David Song, Senior Strategist
Follow on Twitter at @DavidJSong

Latest market news
September 18, 2025 02:48 PM
June 23, 2025 01:22 PM
June 23, 2025 10:39 AM
June 20, 2025 05:23 PM
June 20, 2025 04:46 PM
June 20, 2025 03:35 PM

June 20, 2025 04:46 PM

June 20, 2025 03:35 PM

June 20, 2025 02:18 PM

June 20, 2025 12:21 PM