

US Dollar Outlook: USD/JPY
USD/JPY tumbles to a fresh yearly low (145.19) as US President Donald Trump imposes reciprocal tariffs with a baseline of a 10% increase, with the selloff in the exchange rate pushing the Relative Strength Index (RSI) towards oversold territory.
USD/JPY Selloff Pushes RSI Toward Oversold Territory
USD/JPY still holds below the 50-Day SMA (150.75) amid the failed attempt to test the March high (151.31), and a move below 30 in the RSI is likely to be accompanied by a further decline in the exchange rate like the price action from last year.
Join David Song for the Weekly Fundamental Market Outlook webinar.
David provides a market overview and takes questions in real-time. Register Here
In turn, USD/JPY may track the negative slope in the moving average as the shift in US trade policy raises the threat of a recession, and swings in the carry trade may continue to sway the exchange rate as the Federal Reserve still forecasts lower interest rates for 2025.
US Economic Calendar
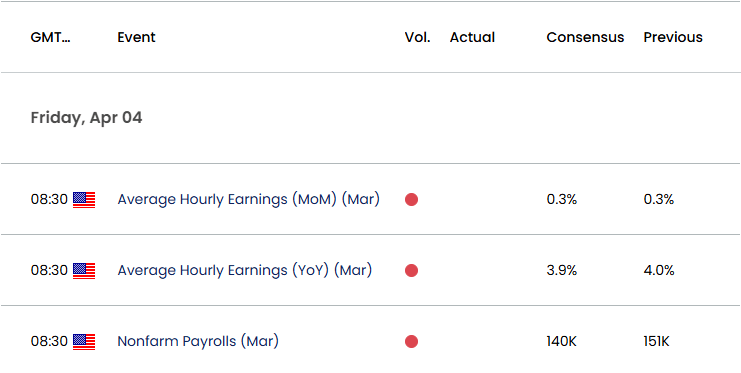
Nevertheless, the update to the US Non-Farm Payrolls (NFP) report may influence USD/JPY as the economy is anticipated to add 140K jobs in March, and evidence of a strong labor market may generate a bullish reaction in the US Dollar as it curbs speculation for an imminent Fed rate-cut.
However, a weaker-than-expected NFP report may keep the Federal Open Market Committee (FOMC) on track to further unwind its restrictive policy, and speculation for lower US interest rates may keep USD/JPY under pressure ahead of the next Fed meeting in May.
With that said, the recent selloff in USD/JPY lead to a test of the October low (142.97) as it appears to be tracking the negative slope in the 50-Day SMA (150.75), but the Relative Strength Index (RSI) may show the bearish momentum abating should the oscillator struggle to push below 30.
USD/JPY Price Chart – Daily
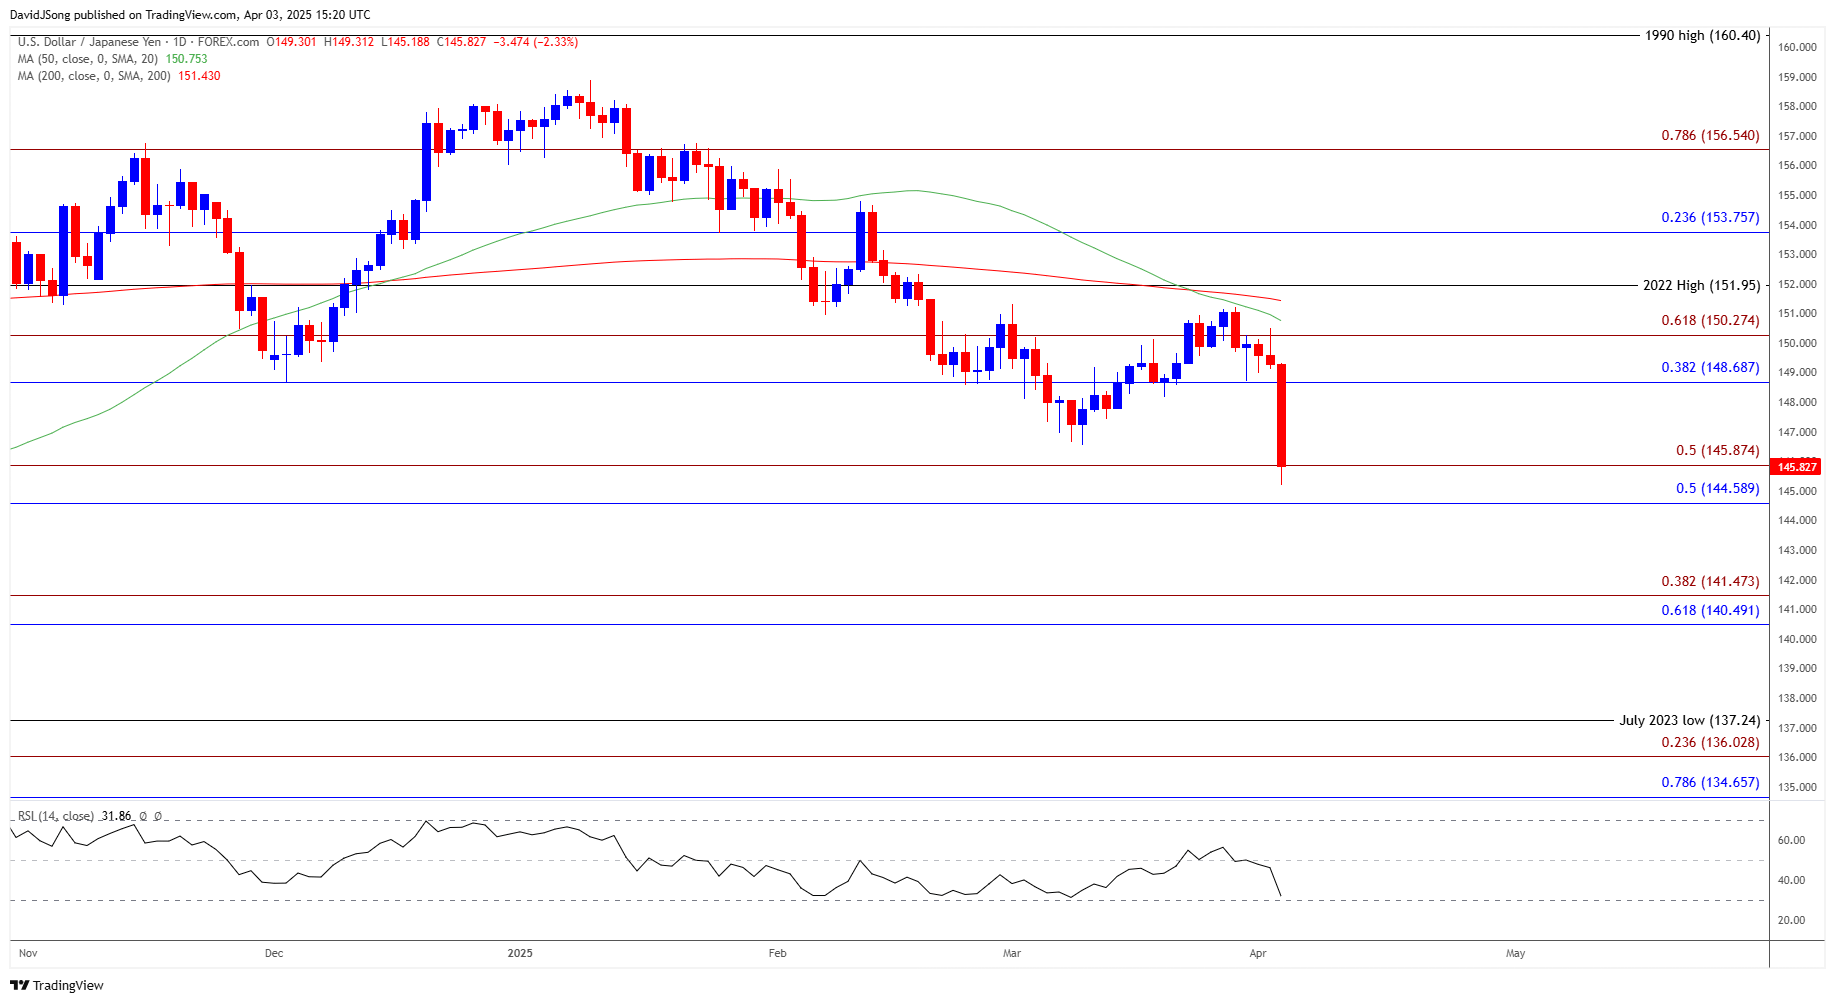
Chart Prepared by David Song, Senior Strategist; USD/JPY on TradingView
- USD/JPY falls to a fresh yearly low (145.19) following the failed attempt to test the March high (151.31), with a break/close below the 144.60 (50% Fibonacci retracement) to 145.90 (50% Fibonacci extension) region raising the scope for a test of the October low (142.97) on the radar.
- Next area of interest comes in around 140.50 (61.8% Fibonacci retracement) to 141.50 (38.2% Fibonacci extension), but lack of momentum to break/close below the 144.60 (50% Fibonacci retracement) to 145.90 (50% Fibonacci extension) region may curb the recent selloff in USD/JPY.
- Need a move back above the 148.70 (38.2% Fibonacci retracement) to 150.30 (61.8% Fibonacci extension) zone to bring the March high (151.31) back on the radar, with the next area of interest coming in around 151.95 (2022 high).
Additional Market Outlooks
Canadian Dollar Forecast: USD/CAD Rebound Fizzles Ahead of Trump Tariffs
Euro Forecast: EUR/USD Cup-and-Handle Formation Takes Shape
Gold Price Halts Decline from Record High Ahead of Trump Tariffs
Australian Dollar Forecast: AUD/USD Coils Ahead of RBA Rate Decision
--- Written by David Song, Senior Strategist
Follow on Twitter at @DavidJSong

Latest market news
September 18, 2025 02:48 PM
June 23, 2025 01:22 PM
June 23, 2025 10:39 AM
June 20, 2025 05:23 PM
June 20, 2025 04:46 PM
June 20, 2025 03:35 PM

June 5, 2025 05:32 PM

May 30, 2025 04:45 PM

May 22, 2025 03:08 PM

May 20, 2025 04:48 PM