
The tide has shifted sharply for the RBA outlook over the past quarter. What began as a widely held expectation for a single rate cut — with perhaps another in 2026 — has given way to a reassessment of inflation risks. Stronger-than-expected CPI and GDP outcomes, alongside a still-resilient labour market, pushed the RBA into a hawkish hold and forced markets to abandon easing expectations.
Money markets are no longer pricing in further cuts, implying the easing cycle may already be over after just three moves, leaving the cash rate at 3.6%. With inflation back in focus, attention has now turned to whether the next policy move is higher — and whether the upcoming quarterly CPI release will be enough to trigger it.
View related analysis:
- AUD/USD Q4 Outlook: Bears Target Slower Growth, RBA Cut
- Australian Dollar Outlook: AUD/USD Steadies as Jobs Data Shifts RBA Odds
- ASX 200 Market Outlook: All Sectors See Red After Hawkish RBA Hold
- Australian Dollar Outlook: AUD/USD Extends Rally Into RBA, FOMC
- Australian Dollar Outlook: Soft Jobs Cools AUD/USD Momentum
Australia’s Q4 CPI: The RBA’s Deciding Factor
Ultimately, a hot Q4 CPI report could pave the way for a rate hike as early as February. With annualised trimmed mean inflation already sitting at the upper end of the RBA’s 2–3% target band, an upside surprise looks plausible and would cement expectations of a hawkish 25bp move.
The RBA took plenty of criticism in the first half of 2025 for repeatedly warning about upside inflation risks — and for much of the year, those concerns appeared misplaced. However, Q4 CPI exceeding both market expectations and the RBA’s own forecasts has largely vindicated that stance, with rate hike odds now back on the rise.
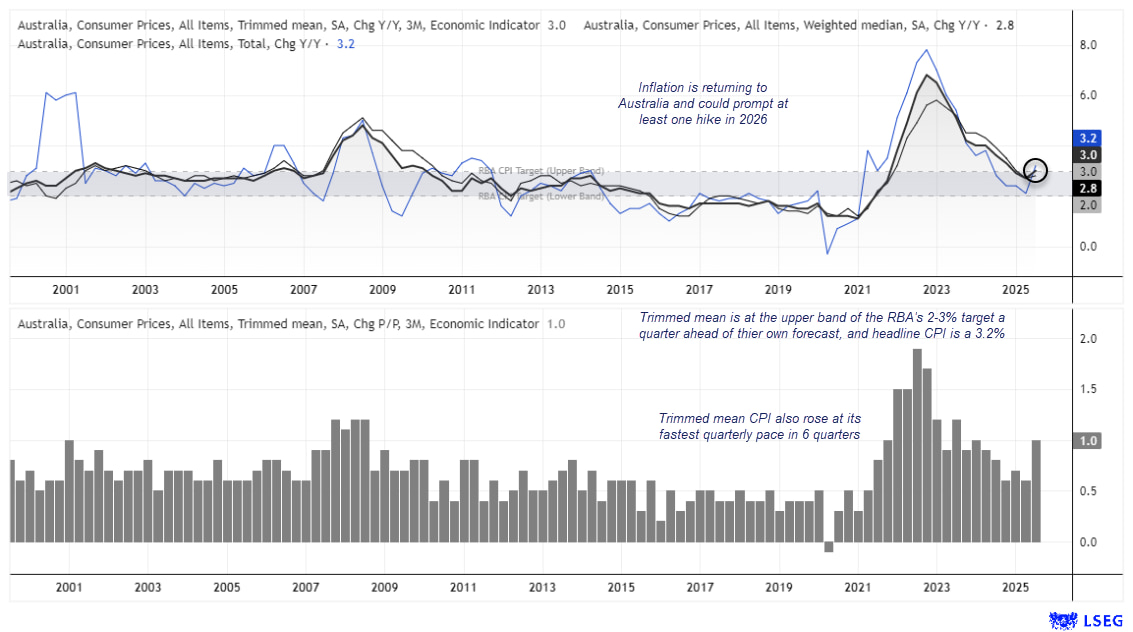
Chart analysis by Matt Simpson – Source: ABS, LSEG
This dynamic forced a hawkish hold in December. While a hike was not on the agenda, the Board made it clear that upside inflation risks have returned and explicitly discussed the conditions that could justify tighter policy. Decisions will be made on a meeting-by-meeting basis, with the quarterly CPI release on 26 January now a key inflection point.
Even so, the RBA is unlikely to pursue an aggressive tightening cycle. If unemployment continues its gradual upward trend — as it has over the past two years — the case for multiple hikes would weaken. In that scenario, a February move could see the cash rate peak around 3.85%, before policy moves to an extended hold through H2 2026.
Takeaway: Unemployment expected to trend gently higher. CPI to rise temporarily and prompt 25bp hike in Feb or later in H1, before cooling in H2 and alleviating pressure to hike beyond 3.85%.

Fed Rate Cuts, Politics and the US Dollar Outlook
The Federal Reserve delivered a well-telegraphed 25bp cut at its December meeting, marking a third successive easing. However, divisions among voting members have thrown the outlook for further cuts into doubt, with the dot plot allowing for just a single 25bp cut in 2026. As such, the labour market may hold the key to how easy 2026 is for the Fed to navigate.
The Fed’s job becomes considerably easier if US labour market data continues to deteriorate. Rising unemployment is disinflationary and would give policymakers scope to deliver two to three rate cuts. That outcome would also align with President Trump’s repeated calls for lower interest rates.
But monetary policy in 2026 is unlikely to be shaped by data alone.
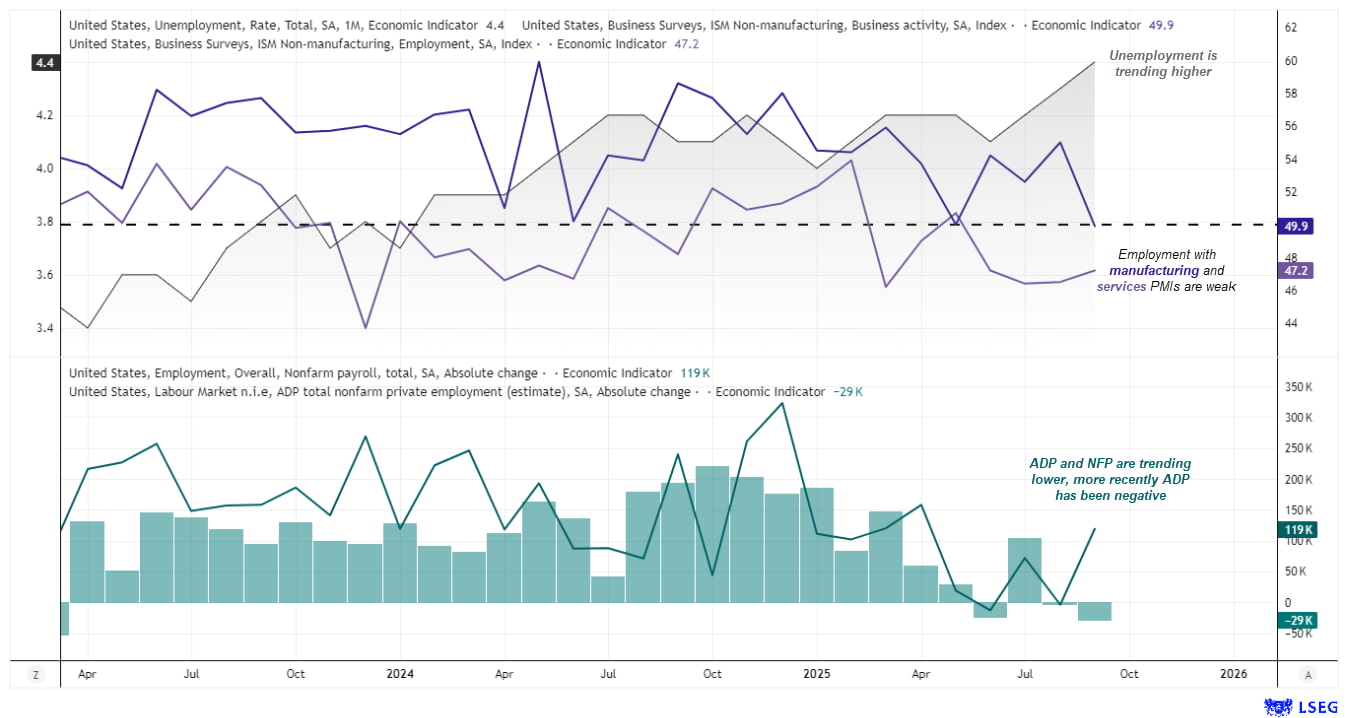
Chart analysis by Matt Simpson – Source: ADP, BLS, ISM, LSEG
The Political Dilemma for Fed Policy
This dynamic creates a political dilemma. A weakening labour market typically feeds through to slower economic growth — hardly desirable for an incumbent administration heading into the midterm elections.
As the midterms approach, the Trump administration is likely to prioritise policies aimed at supporting growth, while continuing to publicly pressure the Fed to ease policy. The challenge is that stronger growth risks reigniting inflation, which would in turn reduce the Fed’s willingness to cut rates.
That said, Trump is highly likely to replace Jerome Powell as Fed Chair when his term expires in May 2026, with a nominee more inclined toward a dovish policy stance.
One low-probability but high-impact tail risk is a legal challenge to Trump’s tariff regime. If the US Supreme Court were to deem the tariffs illegal, it could trigger a sharp risk-off reaction in global markets, weighing heavily on risk-sensitive currencies such as the Australian dollar. While such an outcome appears unlikely given the scale of disruption it would cause to the US economy, it remains a risk worth keeping on the radar.
Balancing these dynamics, at least two rate cuts in 2026 look plausible. A sharper economic downturn could quickly bring three to four cuts into play, increasing downside pressure on the US dollar.
Takeaway: US labour market data is the key swing factor for Fed policy in 2026. A gradual rise in unemployment would open the door to at least two rate cuts — and potentially more if growth deteriorates — weighing on the US dollar. Political pressure ahead of the midterms and a likely shift toward more dovish Fed leadership add to USD downside risks, with risk-off shocks remaining a low-probability but high-impact wildcard.

US Dollar Index (DXY) Technical Analysis
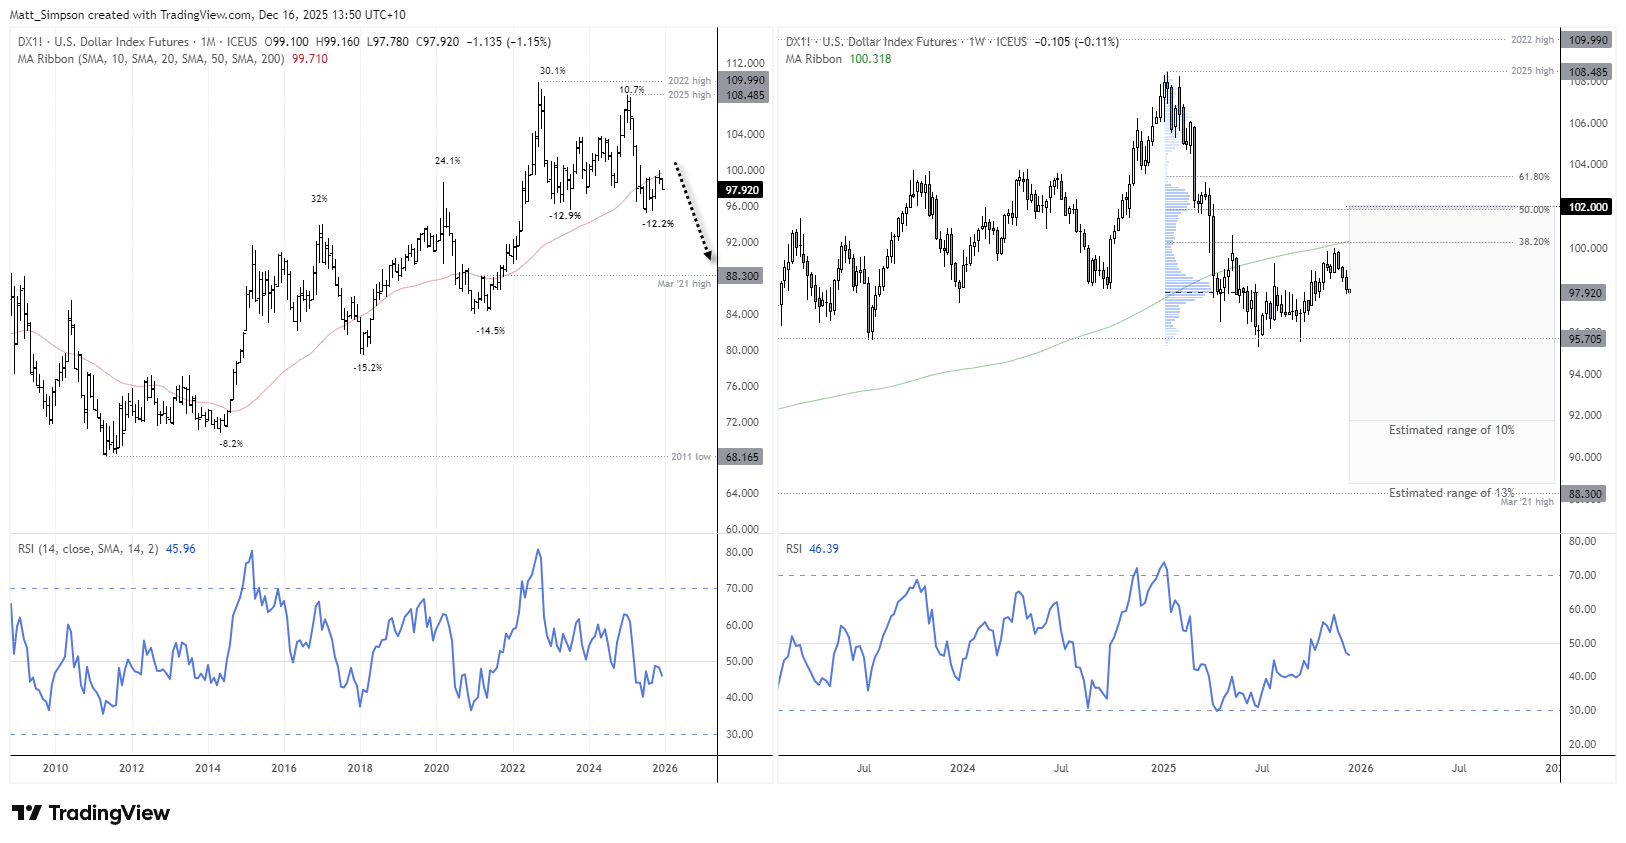
My base case is for a bearish year for the US dollar in 2026, driven by weaker employment trends, softer economic growth, and the likelihood of a more dovish Fed Chair replacing Jerome Powell.
The rally from the 2011 low to the 2022 high appears impulsive. January’s lower high and the subsequent sharp sell-off into the June low suggest the market has topped, with the risk skewed toward fresh cycle lows.
The advance from July 2023 to January 2025 also displays corrective characteristics, with heavy overlap between swings rather than impulsive follow-through.
A three-wave rebound below 100 looks weak. While a final push toward 102 is possible, momentum is expected to roll over in 2026, with scope for a break below 95.
The average annual range of the US dollar index over the past decade is 13.8%, broadly in line with 2025. If DXY remains capped below 102 in 2026, a similar range would imply downside toward 88.7, while a more modest 10% decline from 102 would place the index just below 92.
A bearish outlook for the dollar index would, by extension, support a bullish bias for the Australian dollar.
![]()
Chart analysis by Matt Simpson - data source: TradingView U.S. Dollar Index Futures
Takeaway: The US dollar looks vulnerable in 2026, with corrective price action below 102 suggesting rallies are likely to fade and downside risks building toward the mid-90s or lower — a backdrop that would favour a stronger Australian dollar.
Australian Dollar Technical Outlook for 2026
AUD/USD Seasonality Signals Patience Early, Opportunity Later
Seasonality argues for patience early in the year, with better upside conditions emerging from Q2.
- Average monthly returns for AUD/USD offer little encouragement for bulls in Q1, with January down -0.34% and February–March essentially flat.
- Q4 is the most consistent quarter, with all three months delivering positive average and median returns and win rates above 50%.
- April and June stand out for bulls, each posting win rates of at least 60% alongside positive average and median returns.
- October delivers the strongest median gain at 1.6%, supported by a 56% win rate.
- August is the clear outlier for bears: it carries negative average and median returns and a win rate of just 28% — meaning AUD/USD closes lower 72% of the time.
- May is the next-weakest month, with negative returns and a 60% loss rate.
- It’s also notable that median returns — a more “typical” measure than averages — flip between bearish and bullish throughout the first six months of the year.
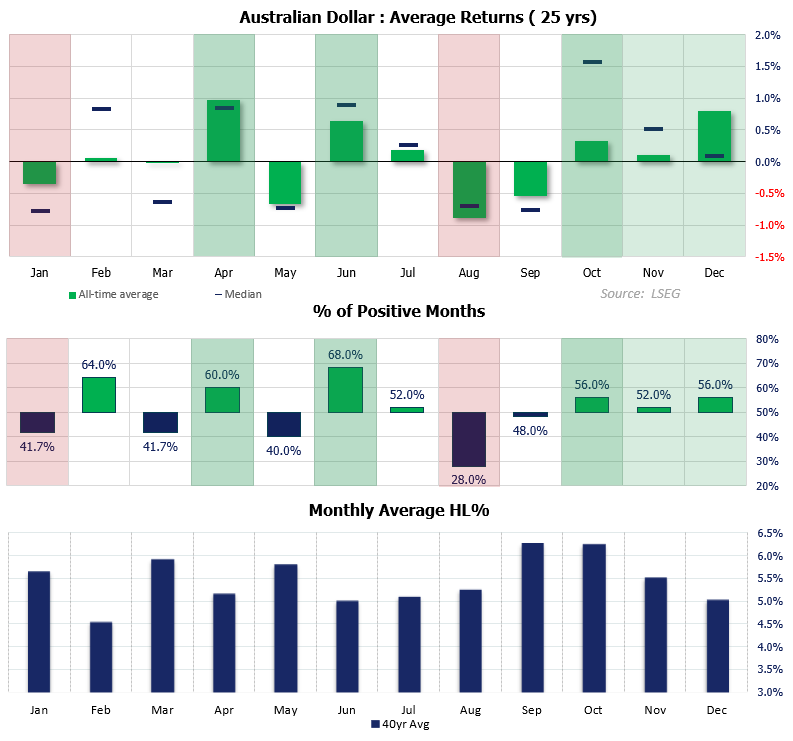
Chart analysis by Matt Simpson – Source: TradingView
AUD/USD Technical Analysis: Long-Term Support Anchors Bullish Bias
The 60c handle has been a stubborn floor for AUD/USD since 2008. Bears rarely break it — and when they do, the move is brief and usually tied to a global shock. The GFC failed to sustain a break, while COVID and Trump’s tariff disputes produced only temporary dips. Once again, AUD/USD is rebounding from this key psychological level.
With the US dollar pencilled in for a bearish year and the Chinese yuan firming, dips appear favourable for AUD/USD bulls.
Seasonally, January tends to be soft, followed by choppy returns through the remainder of Q1. Bullish momentum typically improves in April and June, before the pair often finishes the year strongly in Q4.
The annual high-to-low range for AUD/USD has averaged around 13% in recent years, compared with a 10-year average of 17.7%. Assuming a 2026 low near 0.63, a 13% rally would project upside toward 0.712.

Chart analysis by Matt Simpson – Source: TradingView
AUD/USD Outlook for 2026: Key Risks and Price Scenarios
AUD/USD enters 2026 with a clear macro tailwind. Inflation risks have re-emerged in Australia, keeping the RBA biased toward restraint rather than easing, while the Federal Reserve faces growing pressure to cut as the US labour market cools and political dynamics intensify ahead of the midterms. This policy divergence leaves the balance of risks tilted against the US dollar.
From a technical perspective, the US dollar index appears to have topped, while AUD/USD continues to defend long-term support near the 60c handle. Seasonality argues for patience early in the year, but improving conditions from Q2, combined with a softer USD backdrop, suggest rallies are more likely to extend than fade. Barring a major risk-off shock, the setup favours a stronger Australian dollar in 2026, with scope for AUD/USD to push back toward the low-0.70s over the year.
View the full economic calendar
-- Written by Matt Simpson
Follow Matt on Twitter @cLeverEdge
How to trade with City Index
You can trade with City Index by following these four easy steps:
- Open an account, or log in if you’re already a customer
• Open an account in the UK
• Open an account in Australia
• Open an account in Singapore
- Search for the market you want to trade in our award-winning platform
- Choose your position and size, and your stop and limit levels
- Place the trade