


Dead Cat Bounce: Understanding Short-Lived Recoveries
A dead cat bounce is a brief rally that appears during a strong downtrend before prices resume falling. The term gained popularity in financial media in the 1980s, but the behaviour it describes has existed for decades: a rapid decline, a brief recovery, and another leg lower.
These movements can influence market sentiment and shape how participants interpret the broader trend. Recognising the characteristics of the pattern can help traders understand context, momentum and market psychology during volatile phases.
What Is a Dead Cat Bounce?
A dead cat bounce (DCB) describes a temporary recovery within a broader bearish market structure. The rebound tends to be limited in size compared to the preceding decline and often occurs after a sharp, news-driven move.
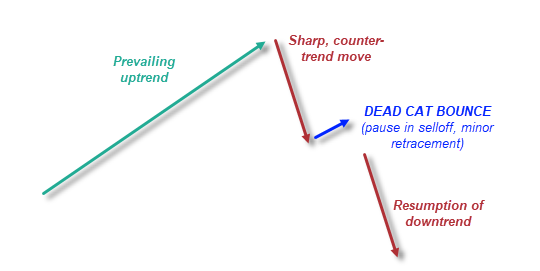
Typical Characteristics of a Dead Cat Bounce
- It forms within a clear downward trend.
- The market has recently experienced a significant sell-off.
- The rebound is relatively small compared with the initial fall.
- The decline often has a fundamental or macro catalyst behind it.
- The structure can resemble a loose flag, though it is not a defined pattern in the traditional sense.
Market participants often view these moves as relief rallies driven by short covering or temporary shifts in sentiment rather than evidence of a sustained recovery.

Historical Example: Dow Jones (DJIA) During the 2020 Pandemic Sell-Off
The early 2020 market collapse produced several well-known dead cat bounce examples across US indices. The Dow Jones Industrial Average (DJIA) displayed a particularly short-lived rebound relative to the S&P 500 and Nasdaq 100.
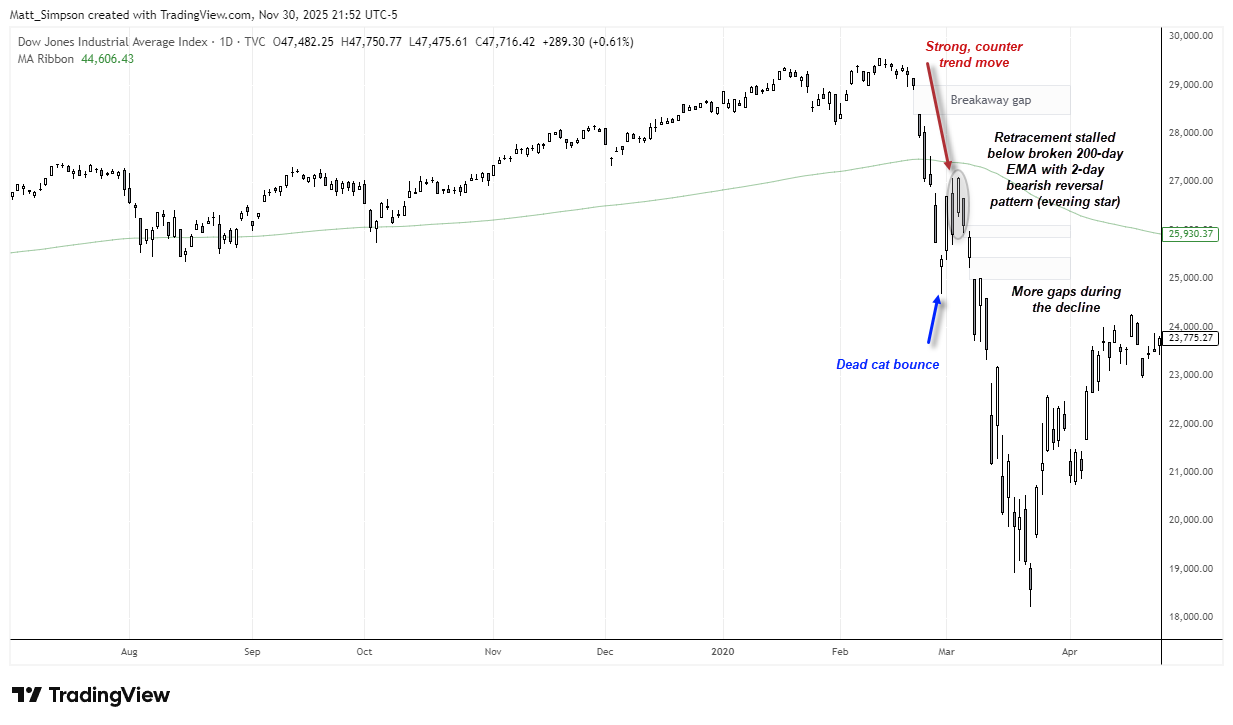
Chart prepared by Matt Simpson: Source - TradingView
Why This Example Was Textbook
- Global shock event – The spread of COVID-19 triggered aggressive risk aversion.
- Breakaway gaps – Extended-hours selling produced gaps on market open.
- Initial impulsive decline – Downside momentum was strong, reflecting extreme uncertainty.
- Brief retracement – The counter-trend recovery was modest and short-lived.
- Continuation of the downtrend – Selling pressure returned and the broader decline resumed.

How Traders Typically Analyse a Dead Cat Bounce
Although a dead cat bounce is easier to identify after it has formed, certain themes tend to appear regularly. These can help observers frame market conditions without implying a specific trading action.
1. Assessing the Recovery’s Strength
A shallow rebound following a sharp sell-off is often viewed as a sign that downside momentum may still dominate. More powerful recoveries may indicate changing sentiment, reducing the likelihood of a DCB.
2. Watching for Reversal Signals
Market participants typically monitor:
- Candlestick reversal patterns
- Fading momentum
- Trendline interactions
- Lower-timeframe structure
These elements can provide context about whether the recovery is weakening.
3. Evaluating Price Action Across Timeframes
Dead cat bounces can appear messy on daily charts, so some traders look at H4 or H1 timeframes to better understand the underlying rhythm of the correction and the continuation.
4. Considering Broader Trend Structure
Once a dead cat bounce has completed, analysts often refer back to long-term trend analysis, support and resistance levels, and macro drivers to assess how the broader move is developing.
Dead Cat Bounce: Final Thoughts
A dead cat bounce is not a precise chart pattern but a behavioural phenomenon seen during periods of heightened volatility. It highlights temporary improvements in sentiment during sustained declines. Understanding how and why these moves appear can help traders better interpret market structure during stressful phases without implying any specific trading decision.
If you want, I can also produce a sidebar glossary, FAQ section, or chart annotations to further enhance SEO and readability.
Dead Cat Bounce: Frequently Asked Questions (FAQ)
What causes a dead cat bounce?
A dead cat bounce typically follows a sharp, emotionally driven sell-off. Short covering, temporary bargain hunting and stabilisation after extreme volatility can all contribute to a brief recovery before the dominant downtrend resumes.
Does a dead cat bounce always lead to further declines?
Not always. While the pattern is often associated with continuing weakness, markets can sometimes stabilise or reverse more sustainably.
How is a dead cat bounce different from a trend reversal?
A trend reversal shows stronger, sustained buying interest and a shift in market structure. A dead cat bounce is usually weaker and short-lived.
Can a dead cat bounce occur in any market?
Yes. The behaviour appears across equities, indices, currencies, commodities and cryptocurrencies.
Is a dead cat bounce a recognised chart pattern?
No. It is considered a behavioural phenomenon rather than a formal geometric chart pattern.
What signals suggest the bounce may be weakening?
Analysts often look at momentum loss, failure at resistance levels and the return of strong selling pressure.


