


A stronger-than-expected US ISM services print helped Wall Street indices stabilise overnight, easing fears of an immediate recession. This allowed the Japanese yen to retreat and gave commodity currencies room to recover, with AUD/USD and NZD/USD bouncing from key support zones.
As attention shifts to the ADP employment report, markets are watching for clues on the Federal Reserve’s rate outlook, which could set the tone for USD/JPY and risk-sensitive currencies heading into the weekend.
View related analysis:
- So how good is APD at predicting NFP, anyway?
- USD/JPY Outlook: Japanese Yen Dominates Amid Wall Street Selloff
- US Dollar Eyes Breakout as EUR/USD, GBP/USD Probe Support, USD/JPY Rallies
- US Dollar Leads FX Majors After Hawkish FOMC: USD/JPY, AUD/USD in Focus
- Nasdaq 100 Outlook: Tech Bulls Rattled as Wall Street Selloff Deepens
- ASX 200 Morning Outlook: Buyers Test Support as BHP and WOW Stabilise
USD/JPY and AUD/USD Find Key Technical Support Ahead of ADP Data
Dip buyers emerged on Wall Street, helping major indices recoup some of Tuesday’s losses after the ISM Non-Manufacturing PMI beat expectations. The 52.4 print marked the fastest expansion in eight months, with new orders rising to 56.2 and employment contracting at a slower pace of 48.2. However, prices paid — a key gauge of underlying inflation — climbed to 70, the highest level since December 2022.
While it wasn’t a true risk-on rally, it was enough to challenge the severity of Tuesday’s selloff. Nasdaq 100 and Dow Jones futures rose around 0.5%, while the S&P 500 gained roughly 0.3% from the prior close. All three indices found support around their 20-day EMAs and monthly pivot points, hinting at potential near term swing lows.
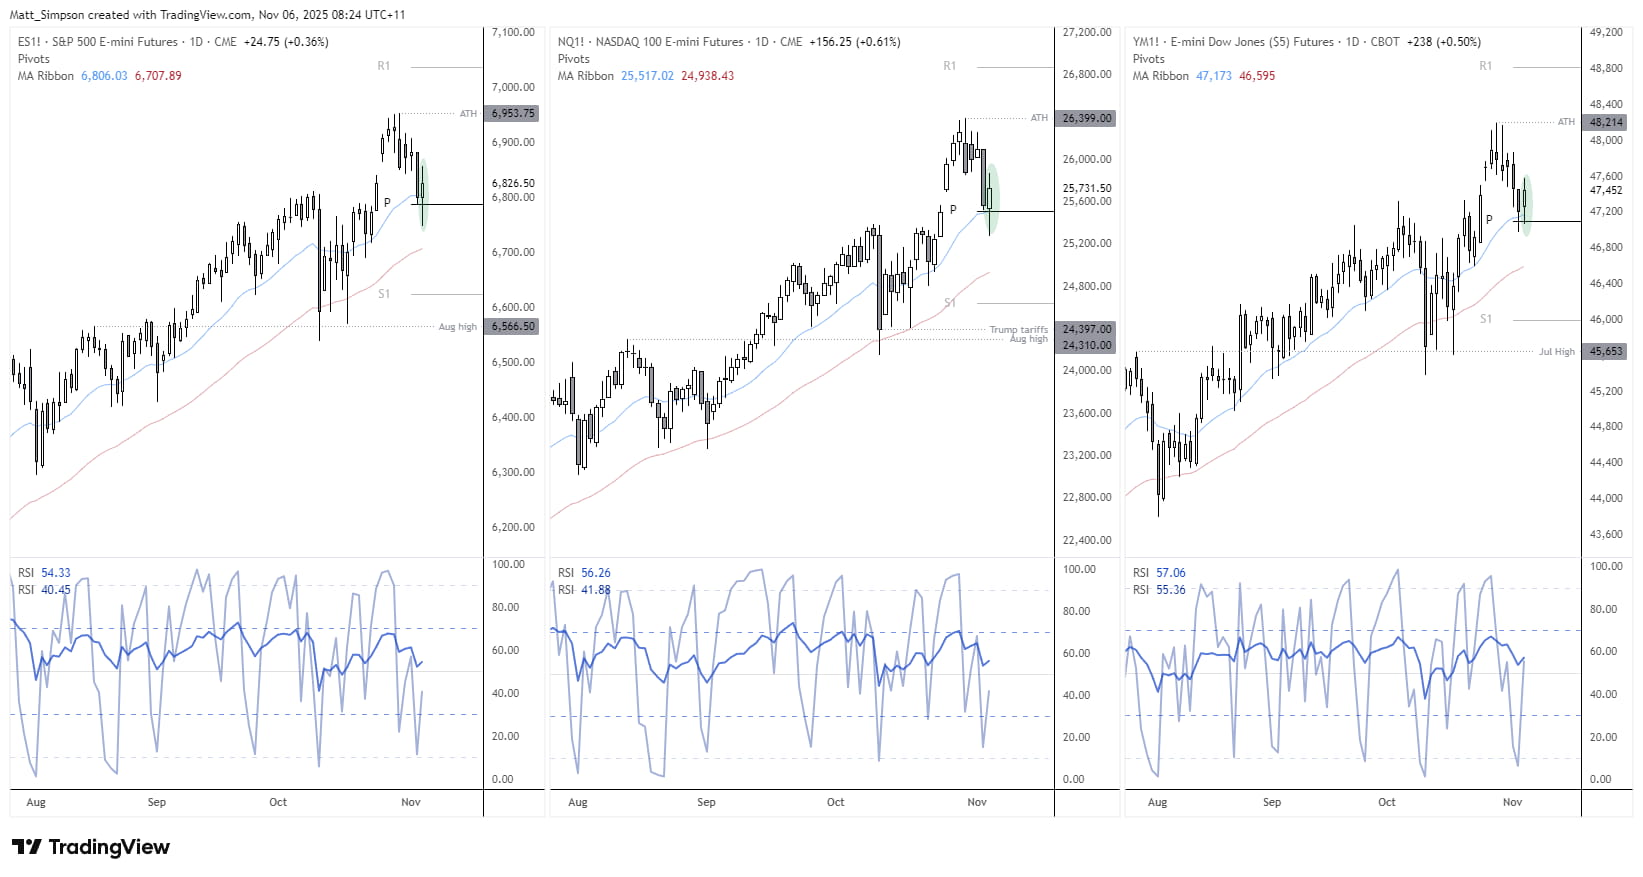
Chart analysis by Matt Simpson, Source: TradingView
Yen Retreats as Risk Appetite Improves
The Japanese yen handed back some of its safe-haven flows, allowing commodity currencies to track Wall Street higher to varying degrees. The Australian dollar held above a messy support zone, with AUD/USD bouncing 0.24%. NZD/USD recovered around 0.3% despite a weak employment report fuelling speculation of a 50-bp RBNZ cut in November. The Canadian dollar also strengthened against the greenback, with USD/CAD forming a shooting star candle just above 1.41 on the daily chart.

Markets Brace for ADP Print to Guide Fed Rate Expectations
Attention now shifts to the ADP employment report, which takes on heightened significance given that Nonfarm Payrolls (NFP) are unlikely to be released in the foreseeable future due to the US government shutdown. This means the ADP data could carry greater market influence than usual, even though it has been a poor predictor of NFP job growth in recent years. A strong ADP print could bolster the US dollar on renewed ‘higher for longer’ Fed bets, whereas a weak reading may revive expectations of a December rate cut, sending risk assets higher and the US dollar lower accordingly.
USD/JPY Technical Analysis: US Dollar vs Japanese Yen
I highlighted on Friday that this week would be pivotal for the US dollar’s rally, and price action on USD/JPY continues to reinforce that view ahead of the ADP employment data. Despite forming a bearish engulfing candle at its cycle high on Tuesday, the pair managed to hold above the 153 handle and recover back above the October high on Wednesday. The 153 level remains a key pivot point for traders this week.
The 4-hour chart shows that the bullish trend remains intact for USD/JPY. Until we see a confirmed break below 153, an upside continuation remains favoured. For now, bulls could seek dips within Wednesday’s range, targeting the 154.80 high and 155 handle, with a breakout above these levels confirming bullish trend continuation. Conversely, a break below 153 would imply a reversal is underway.

Chart analysis by Matt Simpson - data source: TradingView USD/JPY
AUD/USD Technical Analysis: Australian Dollar vs US Dollar
The Australian dollar has its own pivotal level, though it’s less defined than that of USD/JPY. The September close low (0.6515) and 0.6520 mark a nearby resistance zone, which could pave the way for a leg higher if AUD/USD breaks above it.
The pair declined for five consecutive sessions before closing on the 0.6490 high-volume node (HVN) and producing an oversold RSI (2) reading. A small bullish candle has since formed, aided by the bounce on Wall Street. Given the Aussie’s strong correlation with risk sentiment, further equity gains could see AUD/USD push above resistance and extend higher.
However, if risk-off sentiment returns, the 0.6515–0.6521 zone could instead mark a swing high, prompting another move lower for the Aussie.

Chart analysis by Matt Simpson - source: TradingView AUD/USD

View the full economic calendar
-- Written by Matt Simpson
Follow Matt on Twitter @cLeverEdge
How to trade with City Index
You can trade with City Index by following these four easy steps:
- Open an account, or log in if you’re already a customer
• Open an account in the UK
• Open an account in Australia
• Open an account in Singapore
- Search for the market you want to trade in our award-winning platform
- Choose your position and size, and your stop and limit levels
- Place the trade


