


The ASX 200 futures are at a pivotal point as compressed volatility suggests a breakout is near. While a bull flag is forming, the bias remains tilted to the downside with targets at 8616 and 8500.
The Nikkei 225 has tested record highs but now faces signs of exhaustion, while COT data on Nikkei futures shows waning participation, raising questions about the sustainability of Japan’s equity rally. Together, these signals highlight the need for traders to remain cautious as global indices navigate critical levels.
View related analysis:
- ASX 200 and Nikkei 225 Technical Outlook: Reversals and Key Levels in Focus
- USD/JPY and Yen Crosses Analysis: Jobs Revision, Fed Cuts, Technical Outlook
- AUD/USD, AUD/NZD, NZD/USD Price Action Setups
- AUD/USD Weekly Outlook: Australian Dollar Bulls Eye Breakout of 66c
- USD/JPY, AUD/USD, Gold Analysis: COT report
ASX 200, Nikkei 225 Futures Technical Outlook
ASX 200 Futures (SPI 200) Technical Analysis
The ASX 200 appears to be at a pivotal moment. Volatility has been compressed over recent sessions, suggesting that a breakout in either direction is likely.
Last week I highlighted the case for a continued move lower towards the February high at 8616, or even the lows around 8500, though this may require Wall Street and other global indices to also weaken.
The bearish case gained weight on September 3, when momentum accelerated after three consecutive down days and a lower high formed beneath the record peak near 9000. This pattern suggested a deeper pullback could be in play rather than a simple ABC correction.
The bullish counterpoint is that a small bull flag may be forming on the daily chart. Yet even if prices break initially higher, my bias remains for a move down to at least the February high before a durable trough is established.
Ultimately, I expect the ASX to test lower levels, with either a direct break from current prices or a fade into rallies towards 9088—on the assumption that 9000 will not be retested in the near term.
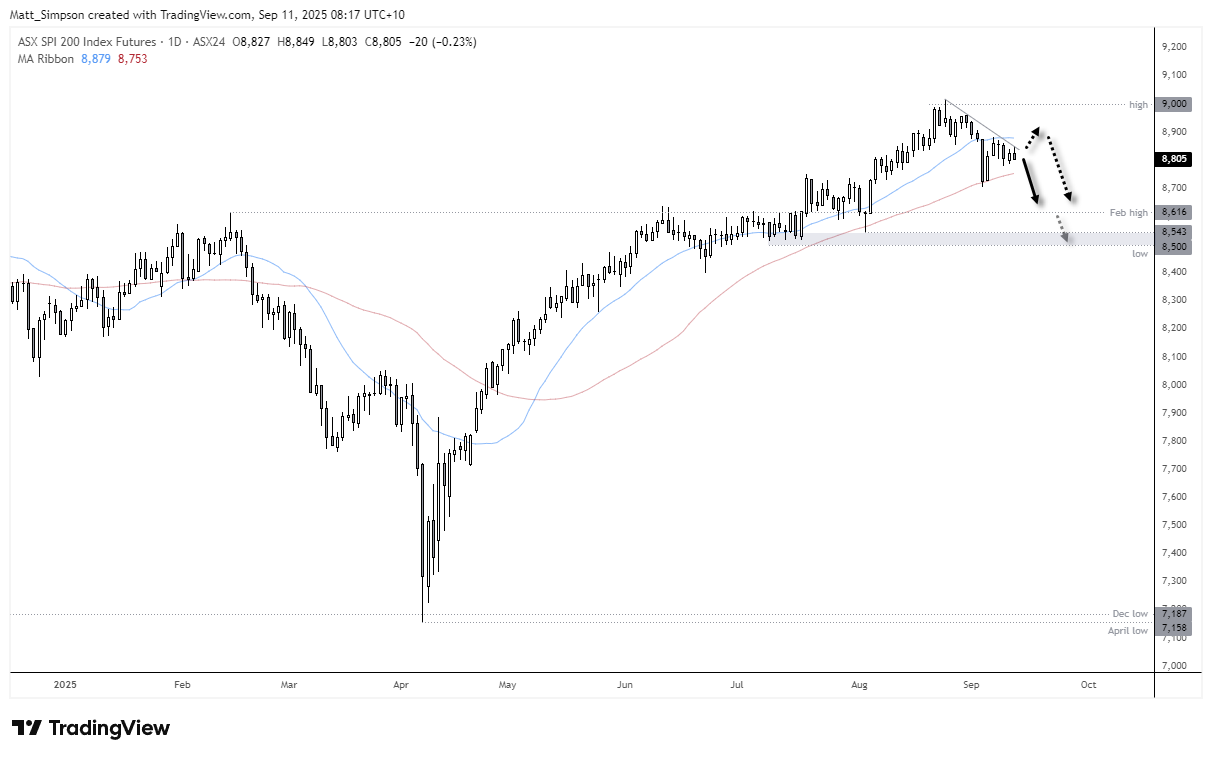
Chart analysis by Matt Simpson - Source: TradingView, ASX SPI 200 Index Futures

ASX 200 Futures (SPI 200): 4-hour Chart
The 1-hour chart shows ASX 200 futures respecting trendline resistance, with momentum turning lower after a bearish engulfing candle formed at that level. The 200-bar SMA also acted as resistance before the reversal candle confirmed.
Overnight consolidation has produced a potential bear flag, so traders will be watching closely after the open for a direct break lower. If prices initially turn higher, bears may look to fade rallies into the 200-bar SMA or trendline resistance.

Chart analysis by Matt Simpson - Source: TradingView, ASX SPI 200 Index Futures
Nikkei 225 Futures (NK) Technical Analysis
Last week I outlined a bullish bias for Nikkei 225 futures over the near term, based upon a falling wedge pattern during an uptrend on the daily chart. Prices were quick to reach target around the base of the target, near its record high.
However, volatility has resurfaced around that key level to show an immediate hesitancy to continue higher. And we could find the Nikkei vulnerable to a shakeout if today’s US inflation figures fail to adequately soften current market expectations of multiple Fed cuts.
The 4-hour chart shows that the Nikkei may also be about to print a lower high, with a doji breaking a 6-bar rally. The fact that the doji has high volume also suggests a ‘change of hands’ from bulls to bears.
Ultimately, I am on guards for a pullback over the near term given the pickup of voltatility around the Nikkei’s previous record high. Bulls may be better positioned to seek bullish setups around lower levels.

Chart analysis by Matt Simpson - Source: TradingView, Nikkei Futures (NKD1!)
Nikkei Futures COT Report: Positioning Analysis
Nikkei bulls may want to note that net-long exposure to Nikkei futures has been trending lower since 2023. Open interest on Nikkei futures, often used as a proxy for volume, is also declining – suggesting diminishing participation behind the rally.
While these developments don’t necessarily signal an imminent peak for the Nikkei, they do highlight a potential loss of momentum as this bullish trend matures.
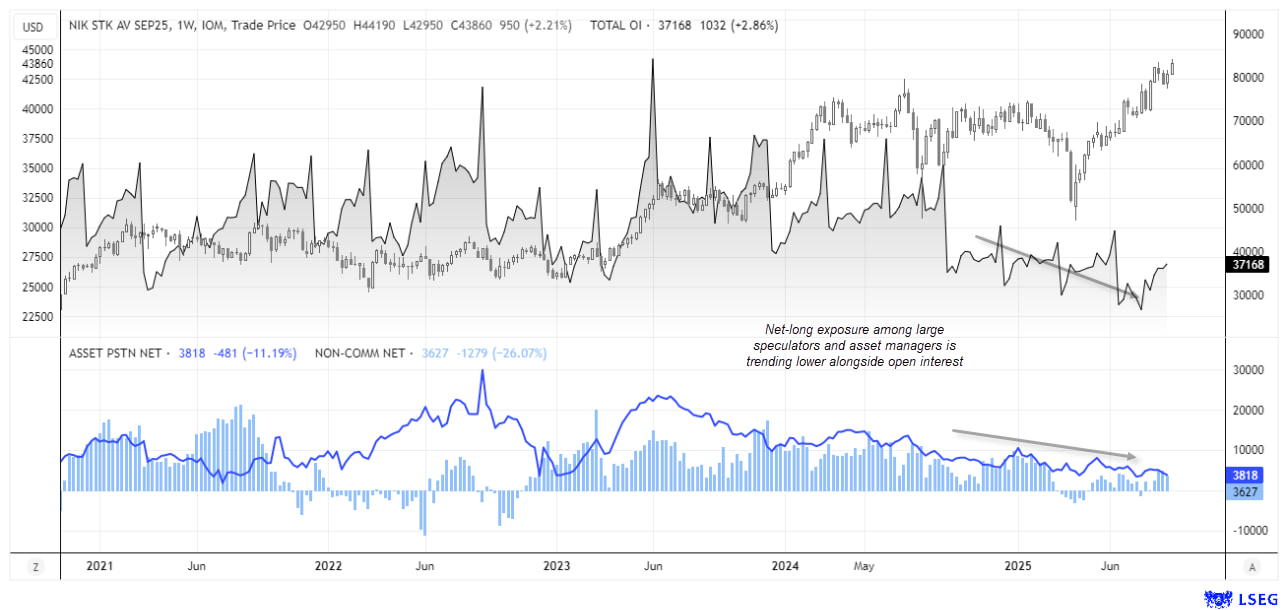
Chart analysis by Matt Simpson - Source: CME, LSEG

Key Economic Events for Traders (AEST / GMT+10)
09:50 JPY BSI Large Manufacturing Conditions, Foreign Bonds Buying, Foreign Investments in Japanese Stocks, PPI (Aug) (USD/JPY, EUR/JPY, Nikkei 225)
11:00 AUD MI Inflation Expectations (Sep) (AUD/USD, AUD/JPY, AUD/NZD)
18:00 USD IEA Monthly Report (WTI Crude, Brent Crude, USD/CAD)
20:00 GBP Thomson Reuters IPSOS PCSI (Sep) (GBP/USD, EUR/GBP, GBP/JPY)
20:00 EUR Germany Thomson Reuters IPSOS PCSI (Sep) (EUR/USD, EUR/GBP, DAX)
21:00 USD OPEC Monthly Report (WTI Crude, Brent Crude, USD/CAD)
22:15 EUR Deposit Facility Rate, Marginal Lending Facility, Monetary Policy Statement, Interest Rate Decision (Sep) (EUR/USD, EUR/GBP, DAX)
22:30 USD Continuing Jobless Claims, Core CPI, CPI, Initial Jobless Claims, Real Earnings (Aug) (S&P 500, Nasdaq 100, USD/JPY)
22:45 EUR German Current Account Balance, ECB Press Conference (Jul/Sep) (EUR/USD, EUR/GBP, DAX)00:15 EUR ECB President Lagarde Speaks (EUR/USD, EUR/GBP, DAX)
00:30 USD Natural Gas Storage (WTI Crude, Brent Crude, USD/CAD)
01:00 USD Cleveland CPI (Aug) (S&P 500, Nasdaq 100, USD/JPY)
01:30 USD 4-Week Bill Auction, 8-Week Bill Auction (S&P 500, Nasdaq 100, USD/JPY)
03:00 USD 30-Year Bond Auction (S&P 500, Nasdaq 100, USD/JPY)
04:00 USD Federal Budget Balance (Aug) (S&P 500, Nasdaq 100, USD/JPY)
06:30 USD Fed's Balance Sheet (S&P 500, Nasdaq 100, USD/JPY)
View the full economic calendar
-- Written by Matt Simpson
Follow Matt on Twitter @cLeverEdge
How to trade with City Index
You can trade with City Index by following these four easy steps:
- Open an account, or log in if you’re already a customer
• Open an account in the UK
• Open an account in Australia
• Open an account in Singapore
- Search for the market you want to trade in our award-winning platform
- Choose your position and size, and your stop and limit levels
- Place the trade


