


A stronger-than-expected Australian employment report reignited expectations of another RBA rate hike, dragging the ASX 200 lower as investors rotated out of rate-sensitive sectors. The index briefly dipped to a three-month low before recovering modestly by the close, though heavy losses among the major banks left sentiment fragile heading into the weekend.
View related analysis:
- Australian Dollar Jumps, ASX Falls as Strong Jobs Data Fuels RBA Hike Bets
- ASX 200 Evening Wrap: Tech and Banks Extend Losses, WOW Perks Up
- Nasdaq 100 Lags Dow Jones: Divergent Signals Among Nvidia, Apple, Meta
- ASX 200 Evening Wrap: CBA Drags Index Lower as Financials Buckle
ASX 200 Market Snapshot
- A firm employment report for Australia renewed bets of another RBA rate hike, sending as much as -1.1% lower before closing the day down -0.5%.
- The index briefly traded at a 3-month low before recovering back above its September low by the day’s close.
- 9 of the 11 ASX sectors declined, led by Information Technology (XIJ) and Real Estate (XRE).
- Classic risk-off patterns persisted, with Financials, Technology, and Consumer Discretionary stocks falling, while Technology and Real Estate led the losses.
- Thirteen of the top twenty ASX stocks finished lower, led by ANZ, which fell -5.3% after gapping down from its record high.
- 128 ASX 200 stocks declined, 65 advanced, 7 were unchanged
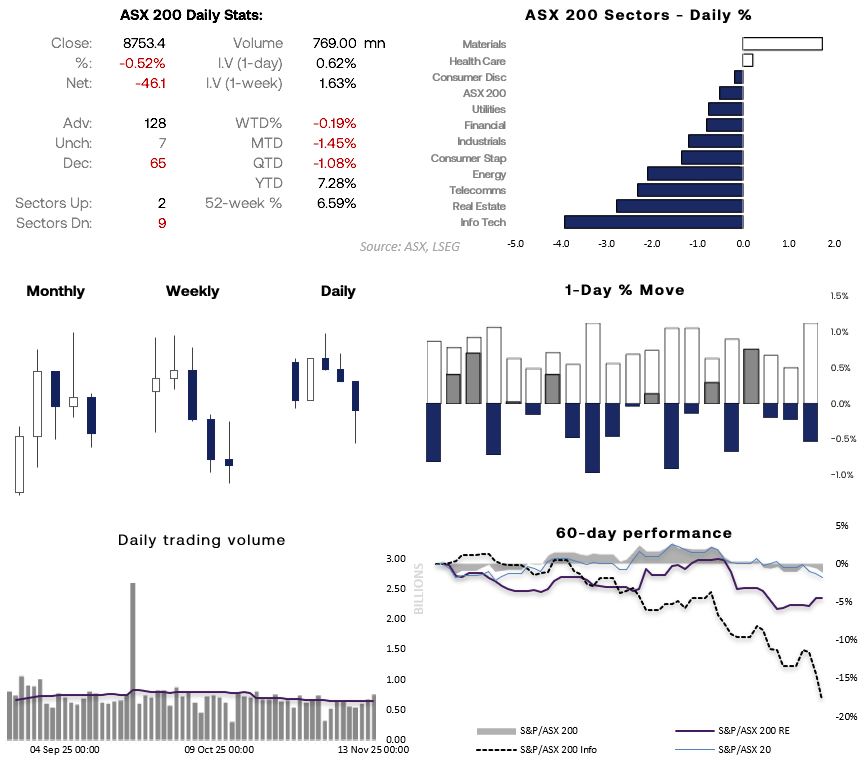
Chart analysis by Matt Simpson - source: ASX, LSEG

ASX 200 Sector Analysis
The Financials sector (XFJ) declined for a third straight day to a three-month low, marking its worst three-day run in seven months. With banking stocks under sustained pressure, the ASX 200 could remain vulnerable to further selling unless we see a meaningful turnaround in the sector.
- Consumer Discretionary stocks (XDJ) fell to a five-month low.
- Energy (XEJ) snapped a five-day winning streak, sliding -2.3% in its worst session in 19 days.
- Information Technology (XIJ) dropped to a six-month low and is on track for a third consecutive weekly decline.
- Consumer Staples (XSJ) also weakened, underscoring the broader risk-off tone despite its usual defensive appeal.
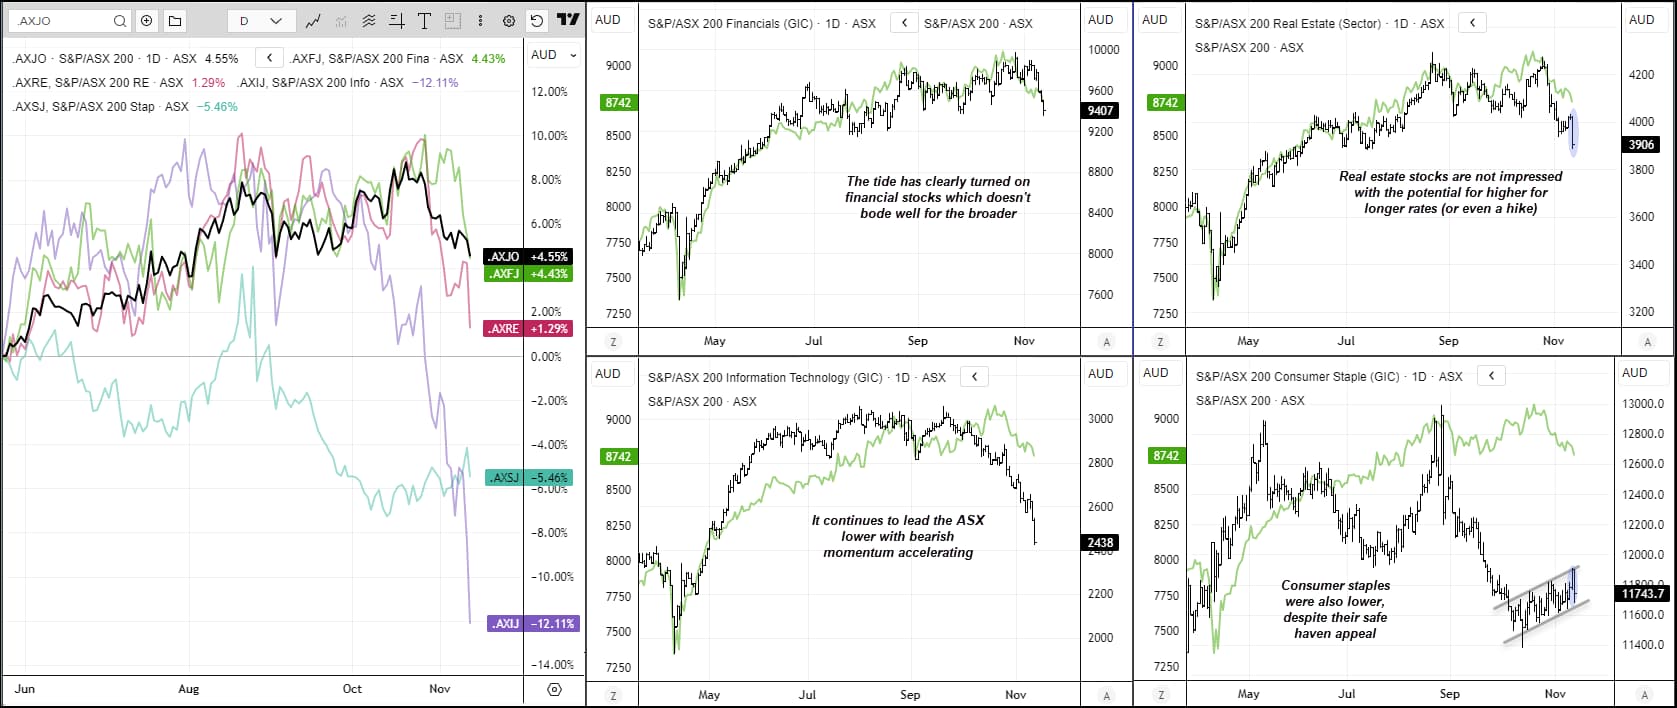
Chart analysis by Matt Simpson - source: ASX, LSEG
ASX 200 Bank Stocks Under Pressure as ANZ Leads Declines
ANZ Group (ANZ) led losses with a -4.9% decline, though support emerged around its 20-day EMA and the high-volume node from prior congestion. Trading volume jumped to a one-month high, signalling potential bearish initiation.
While the broader uptrend remains intact, a break below the 35.94 swing low could trigger a deeper correction.
- Westpac (WBC) fell for a second session after failing to hold above $40 on Wednesday
- National Australia Bank (NAB) slipped -1.6%.
- Commonwealth Bank (CBA) managed a modest 0.8% rebound, though it barely offset the -9.4% slide over the previous two sessions
Traders should keep a close eye on the big four banks — further weakness here could spell deeper trouble for the ASX 200.
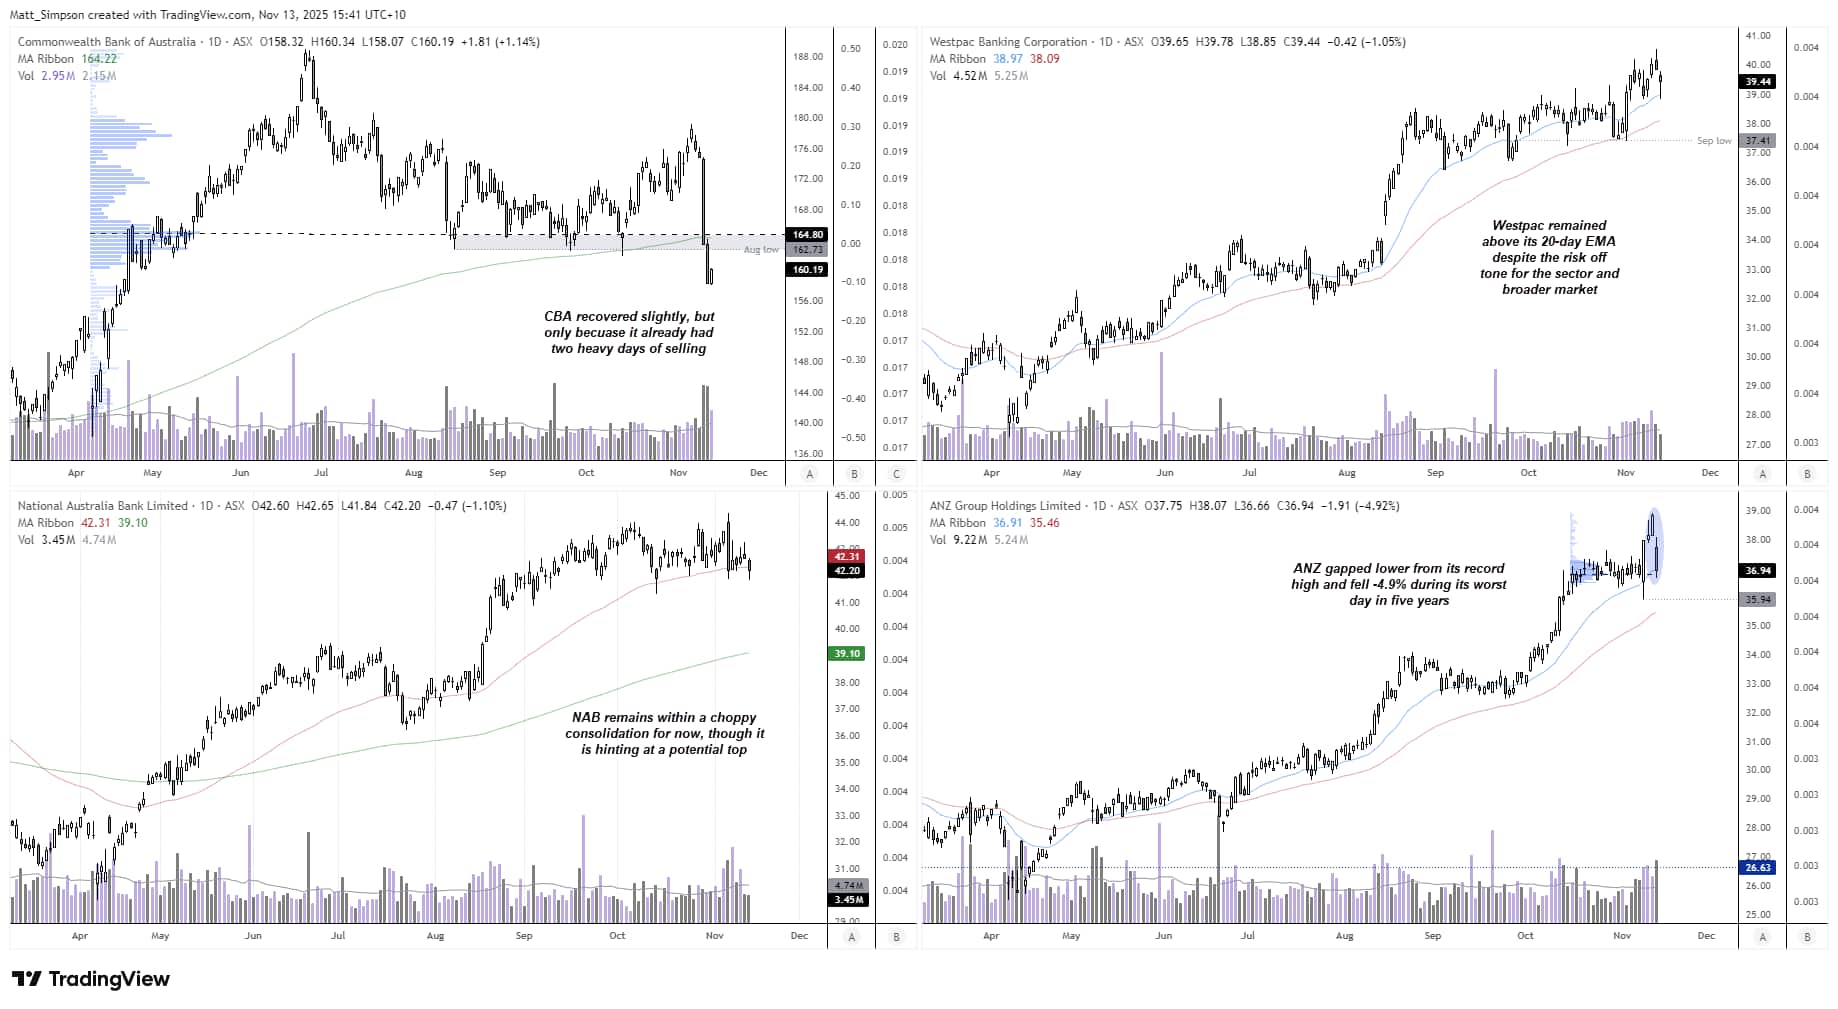
Chart analysis by Matt Simpson - Source: TradingView, ASX

ASX 200 Futures (SPI 200) Technical Analysis
The daily chart shows the ASX 200 struggling to break decisively below the September low — for now. That doesn’t mean it won’t eventually do so. The index has already formed a clear leg lower into the current choppy consolidation, and price action across key sectors suggests further downside risks remain for the broader Australian share market.
Bears may look to fade rallies towards the weekly pivot point near 8800 or highs around 8900, anticipating a break beneath the September low. The February high at 8663 and the 200-day EMA near 8640 are the next key downside levels to watch.
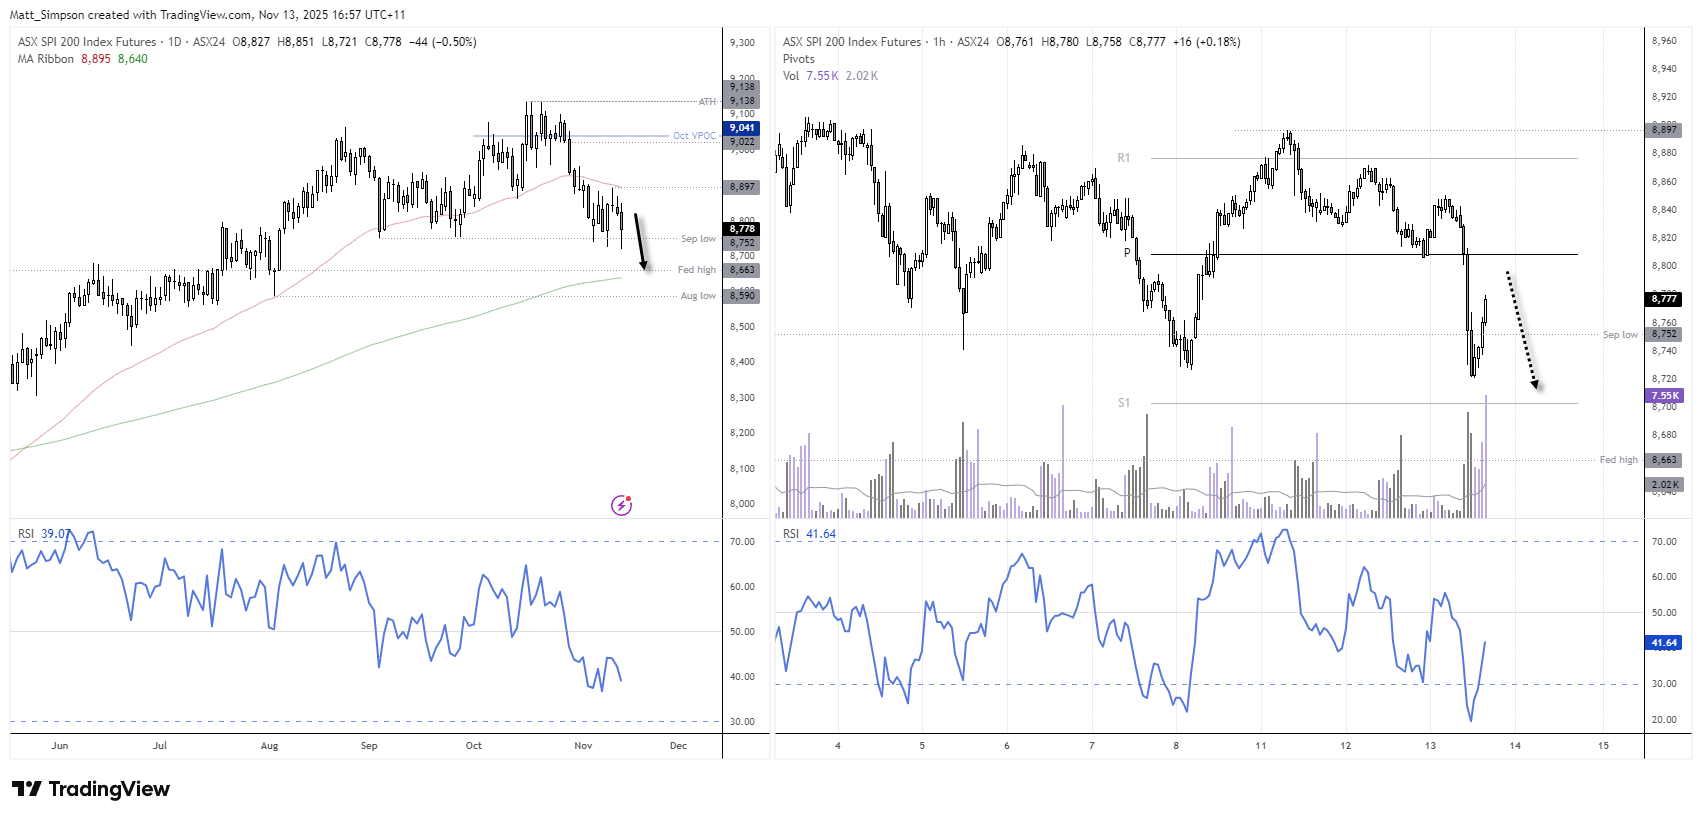
Chart analysis by Matt Simpson - Source: TradingView, ASX
View the full economic calendar
-- Written by Matt Simpson
Follow Matt on Twitter @cLeverEdge
How to trade with City Index
You can trade with City Index by following these four easy steps:
- Open an account, or log in if you’re already a customer
• Open an account in the UK
• Open an account in Australia
• Open an account in Singapore
- Search for the market you want to trade in our award-winning platform
- Choose your position and size, and your stop and limit levels
- Place the trade


