


The ASX 200 continues to grind higher, but momentum is slowing near cycle highs. With volumes subdued and options positioning clustered around 9000, traders face a clear decision point: breakout continuation or renewed downside pressure.
View related analysis:
- FX Futures Positioning: USD, EUR, GBP, CAD | COT report
- Japanese Yen Price Action Setups Across USD/JPY, GBP/JPY, EUR/JPY, CAD/JPY
- Australian Dollar Outlook: AUD/USD Rally Vulnerable to Chop at the Top
- Nasdaq 100 Leads Risk-Off as Tech Earnings Weigh, Gold Slides
- ASX 200 Market Outlook: CBA Surges, CSL Plunges as Earnings Diverge
ASX 200 Market Snapshot
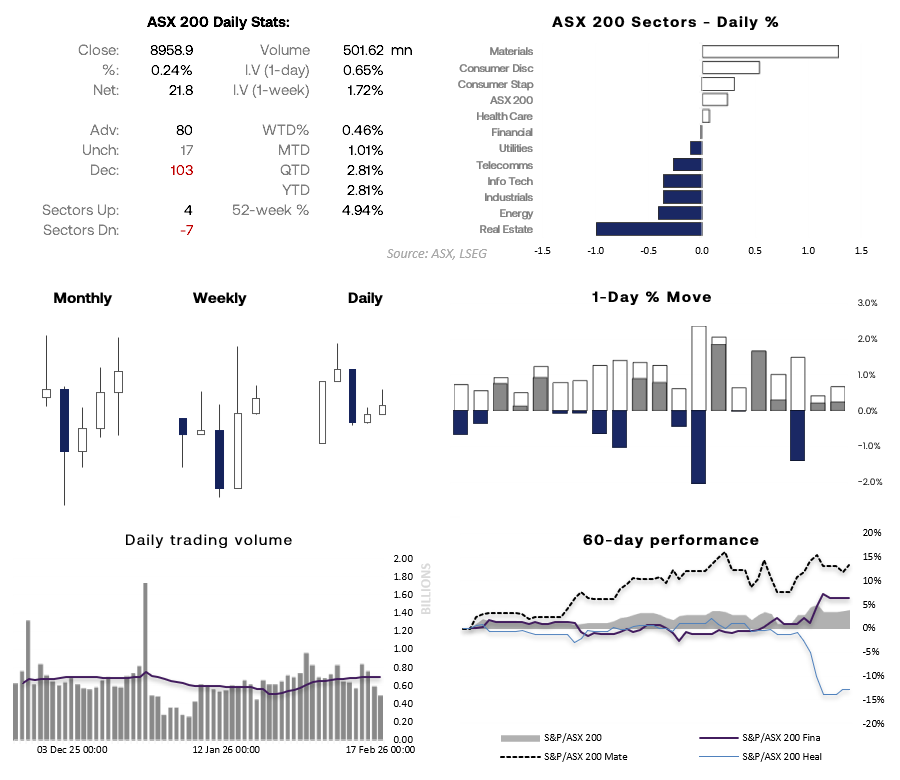
- The ASX 200 edged higher for a second consecutive session amid low-liquidity trade, with daily volumes declining again and remaining well below average.
- A higher wick formed on the ASX 200 cash chart, leaving a small shooting star candle by Tuesday’s close – hinting at a potential near-term swing high.
- A risk-off tone filtered through Asian indices, while Wall Street futures softened and the Japanese yen strengthened ahead of key US–Iran talks later in the day.
- Wednesday has delivered the lowest average daily range over the past 15 months. However, that pattern could be disrupted if geopolitical risks intensify following US–Iran talks and liquidity returns after the US long weekend.
- Sector performance was mixed. Materials (XMJ) and consumer discretionary (XDJ) led five sectors higher, while real estate (XRE) and energy (XEJ) weighed on the six sectors that closed lower.
Source: ASX, LSEG
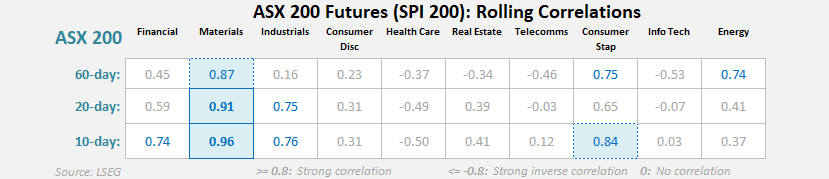
ASX 200 Correlations / Sector Analysis
Source: ASX, LSEG
ASX 200 (XJO) Options Analysis
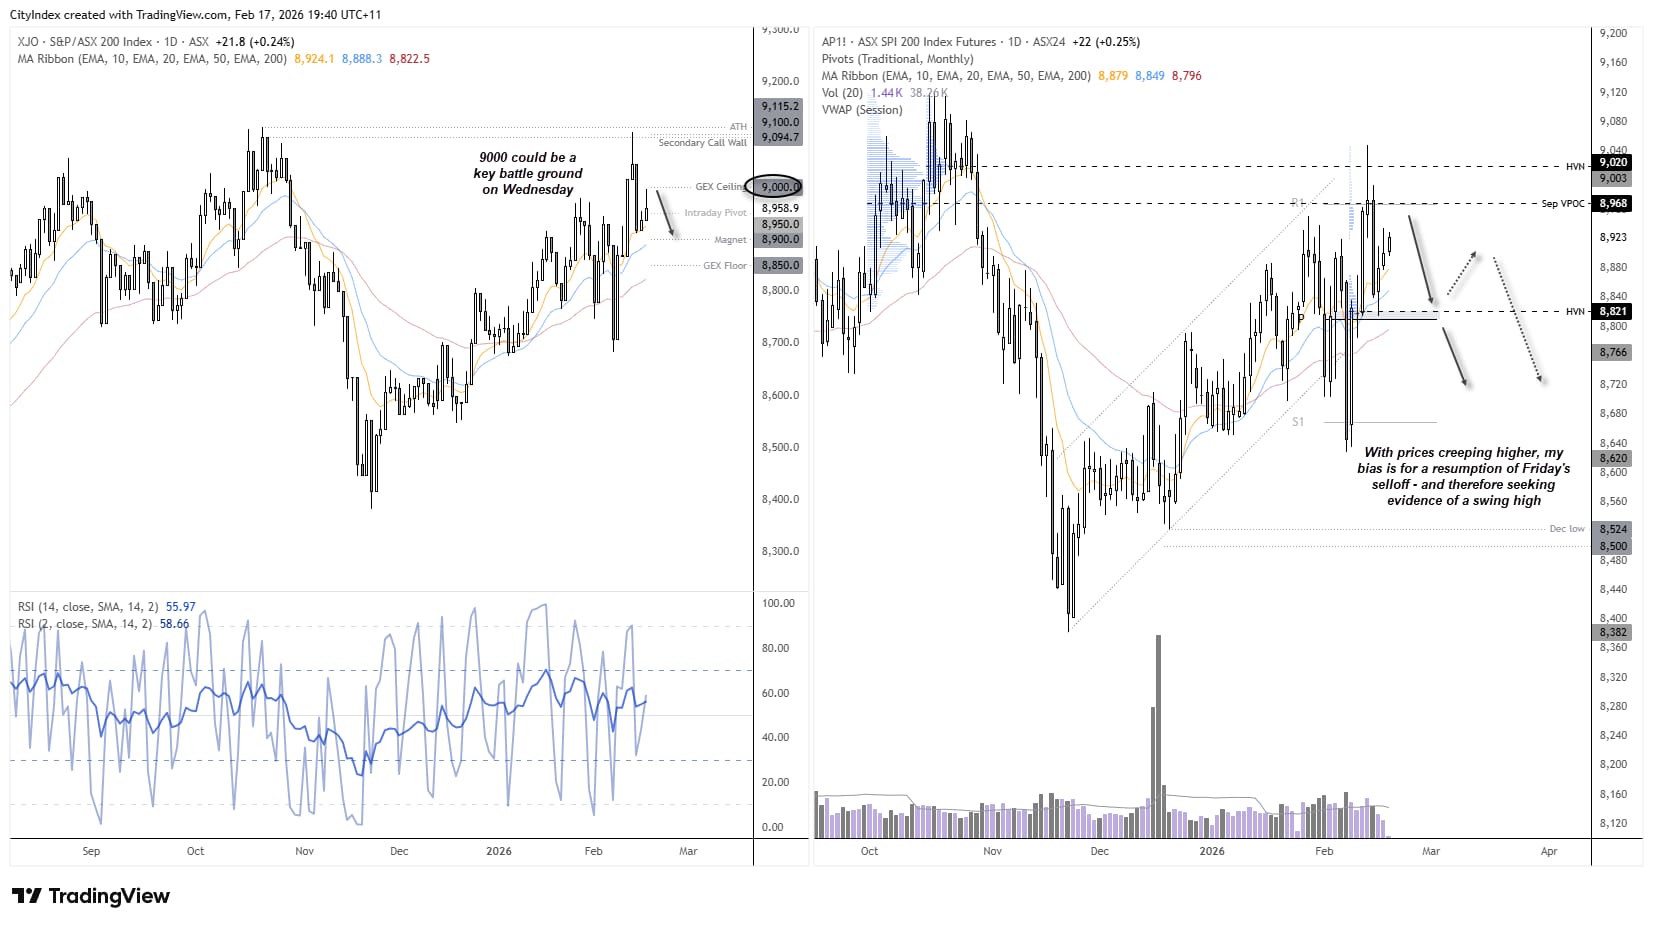
Options positioning suggests the ASX 200 cash market (left) may remain rangebound unless we see a decisive breakout.
The 9000 level stands out as the primary upside barrier, with a large concentration of call options clustered there. That could limit gains unless buyers can establish acceptance above it.
On the downside, 8850 appears to provide solid support, with heavy put positioning likely to slow pullbacks into that zone. Between those two levels, 8900 may act as a short-term pivot where price could gravitate during quieter sessions.
In short, the ASX 200 looks boxed between 8850 and 9000 for now. A sustained break and hold above 9000 would expose a move toward 9050–9100, while a decisive move below 8900 could open the door for a retest of 8850.

SPI 200 (ASX 200) Futures Outlook
My bearish bias was invalidated on Wednesday by a clear bullish range expansion candle. While bulls attempted to push to a record high on the cash market on Thursday, prices reversed to leave a shooting star candle on both the cash index and futures. That one-bar reversal was followed by a distinctly bearish session on Friday.
With prices creeping higher again, it appears the market is testing resistance once more. The 9000 level remains pivotal for the cash index. I am now looking for signs of a resumption of Friday’s selloff, ideally with momentum pushing prices back below Friday’s low.
Source: ASX, TradingView
View the full economic calendar
-- Written by Matt Simpson
Follow Matt on Twitter @cLeverEdge
How to trade with City Index
You can trade with City Index by following these four easy steps:
- Open an account, or log in if you’re already a customer
• Open an account in the UK
• Open an account in Australia
• Open an account in Singapore
- Search for the market you want to trade in our award-winning platform
- Choose your position and size, and your stop and limit levels
- Place the trade


