


The ASX 200 extended its rally to a fourth straight session, but momentum is stalling at 9,200 — a key options and technical resistance level. A hanging man candle at record highs suggests buyers are losing conviction just as geopolitical tensions reintroduce headline risk.
Energy and materials are offering support, tracking strength in crude oil and commodity prices. However, with options expiry approaching and offshore markets driving sentiment, the index faces a pivotal test near current levels.
View related analysis:
- Australian Dollar Outlook: AUD/USD Bullish Bets Face Geopolitical Test
- ASX 200 Market Outlook: WOW Rallies, CBA Stalls as 9,200 Caps Gains
- FX Futures Positioning: US Dollar, EUR/USD, GBP/USD COT report
- US Dollar Outlook: DXY Hints at a Swing High, but COT Signals Diverge
ASX 200 Holds Below 9,200 as Geopolitical Risks Build
ASX 200 Market Snapshot
- The ASX 200 technically closed higher for a fourth day, though its hanging man candle at 9200 resistance underscores the importance of that level this week
- The ASX did well to recoup all of the day’s losses given the weekend headlines, though unless we see a full resolution in the Middle East then downside risks remain – particularly if tensions escalate
- The energy sector (XEJ) was the strongest of 4 advancing sectors, tracking crude oil prices which had earlier risen as much as 12%
- Materials (XMJ) also rose 2% thanks to a squeeze on commodity prices
- The risk-of tone weighing on the tech stocks, with the information technology sector (XIJ) falling -3% and finance (XFJ falling (-1.8%)
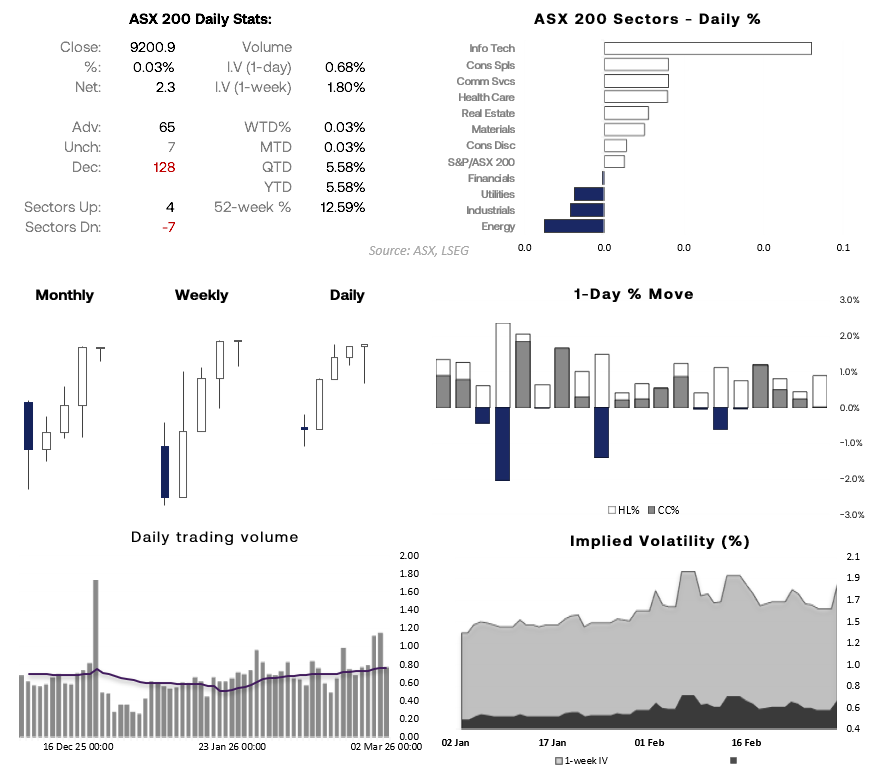
Source: ASX, LSEG

ASX 200 Correlations Signal Strong Ties to Materials and Global Equities
Correlation data shows the ASX 200 remains tightly linked to materials and offshore equity markets, particularly the Nikkei and FTSE 100. The 60-day correlation with materials is very strong, reinforcing just how dependent the index remains on the commodity complex.
Shorter-term correlations have picked up again with global indices, suggesting the ASX is trading more as part of the broader risk trade rather than on purely domestic drivers. Meanwhile, correlations with bonds and gold remain weaker or mixed, implying defensive flows are not the dominant force right now.
In short, if commodities and global equities hold firm, the ASX 200 likely does too. But if offshore risk appetite wobbles, local resilience may prove limited.
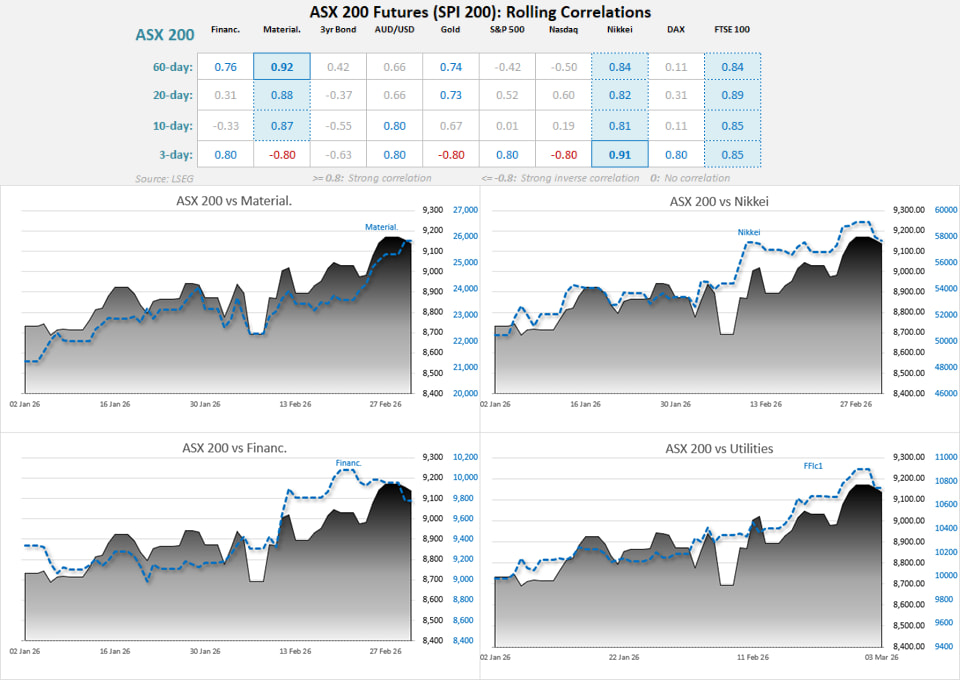
Source: ASX, LSEG

ASX 200 Technical Analysis
9,200 Remains the ASX 200 Battleground Amid Geopolitical Tensions
With two days to expiry, the ASX 200 is boxed between firm put support at 9,025 and heavy call resistance at 9,200 — a clear battleground for index traders. A clean break and sustained hold above 9,200 could open the door to 9,250. Beyond that, the options structure thins out, increasing the risk of a faster extension towards 9,350–9,400.
However, unless price can decisively accept above 9,200, the higher-probability scenario into expiry favours continued rotation between 9,025 and 9,200 rather than an immediate sustained breakout.
On the downside, escalating Middle East tensions inject headline risk into an otherwise technical setup. A break below 9,025 would weaken the near-term support structure and shift focus to 9,000 initially. If that level gives way, gamma support thins further and downside momentum could accelerate — particularly if Wall Street futures soften and broader risk appetite deteriorates.
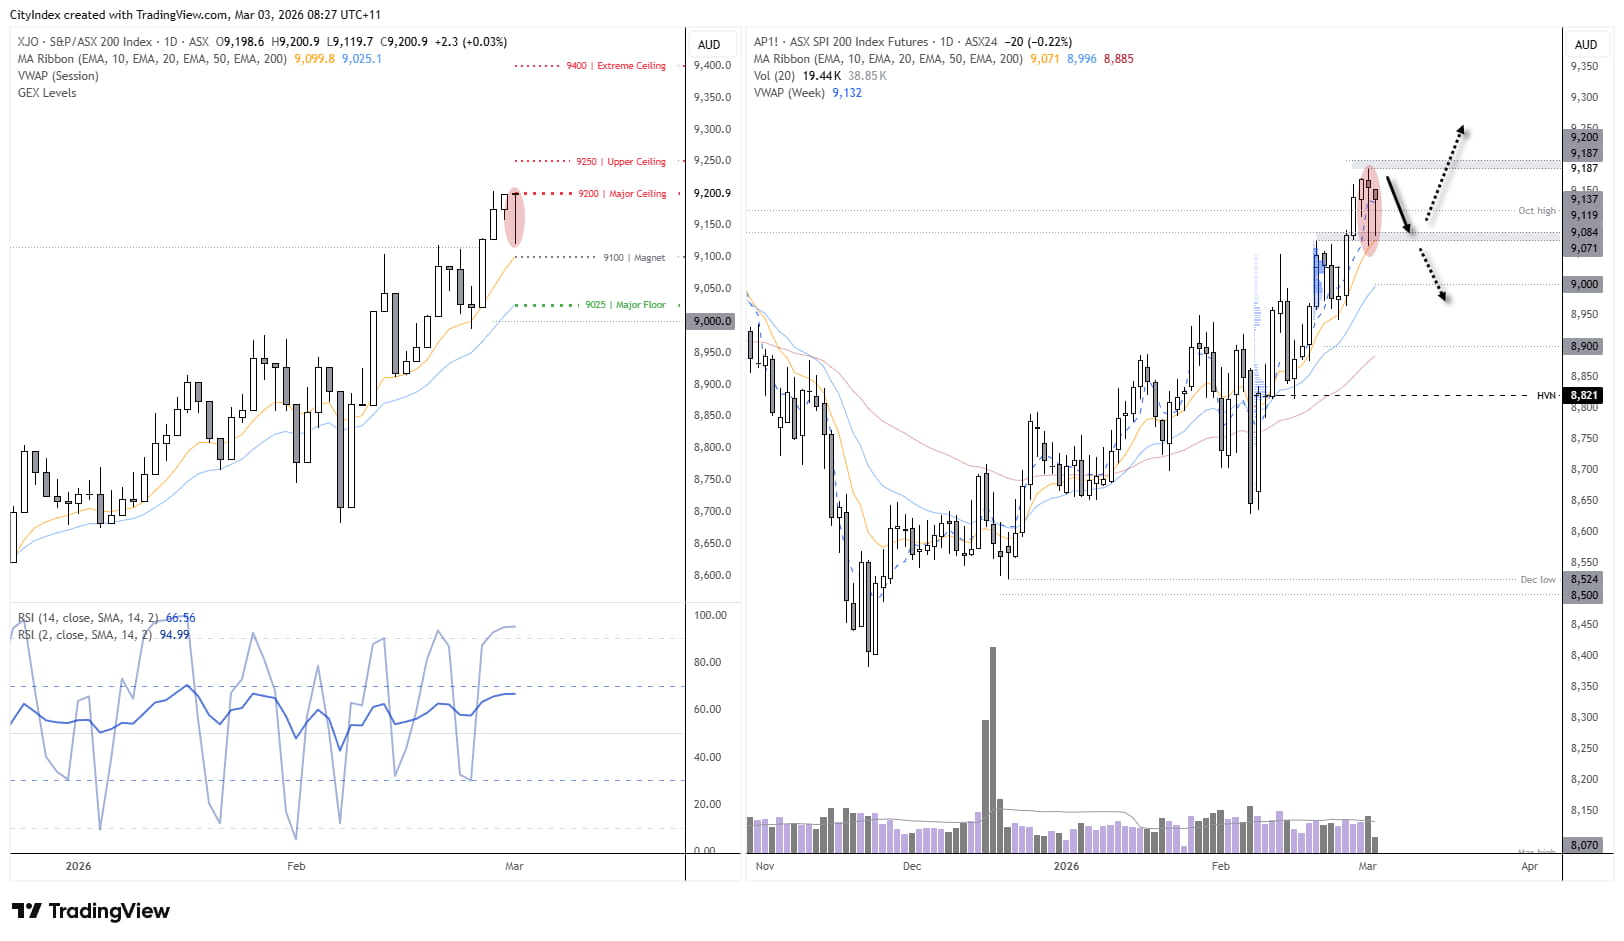
Source: ASX, TradingView
9,200 Resistance Holds as Hanging Man Signals Caution on the ASX 200
The ASX 200 cash index printed a hanging man candle at 9,200 options resistance, while SPI 200 futures echoed the signal during overnight trade beneath record highs. That dual rejection reinforces the technical importance of the 9,200 region.
Without a clear risk-on catalyst, traders may look to fade rallies towards the overnight highs or Monday’s cash high, keeping a short-term bearish bias within the established range. For a sustained breakout in either direction, markets may require either a clear de-escalation or a material escalation of geopolitical tensions.
View the full economic calendar
-- Written by Matt Simpson
Follow Matt on Twitter @cLeverEdge
How to trade with City Index
You can trade with City Index by following these four easy steps:
- Open an account, or log in if you’re already a customer
• Open an account in the UK
• Open an account in Australia
• Open an account in Singapore
- Search for the market you want to trade in our award-winning platform
- Choose your position and size, and your stop and limit levels
- Place the trade


