


The ASX 200 has absorbed its sharpest pullback in several weeks without breaking key technical support, keeping the broader structure intact for now. While recent losses highlight fragile risk appetite, stabilising momentum signals suggest the index may yet attempt another push higher — albeit with downside risks still firmly in play.
View related analysis:
- Australian Dollar Outlook: Momentum Fades as US Data Takes Centre Stage
- Australian Dollar Outlook: Soft Jobs Cools AUD/USD Momentum
- ASX 200 Market Outlook: CBA Looks Set to Bounce, Make or Break for BXB
- ASX 200 Market Outlook: All Sectors See Red After Hawkish RBA Hold
ASX 200 Outlook: Key Support Holds as Momentum Stabilises
ASX 200 Market Snapshot
- The Australian share market suffered its worst daily loss in 16 on Monday, though the ASX cash market only retraced around two thirds of Friday’s strong rally
- 10 of the 11 main ASX 200 sectors declined, led by materials (XMJ) and health care (XHJ), consumer discretionary (XDJ) was the only to advance
- The ASX metals and miners index (XMM) fell -2.4% from its record high and BHP to a 2-week low, potentially from profit taking after posting strong gains this year
- The ASX all Ords index (XDJ) retraced -2% from its record high with spot gold prices approaching a potential resistance level around its own record high
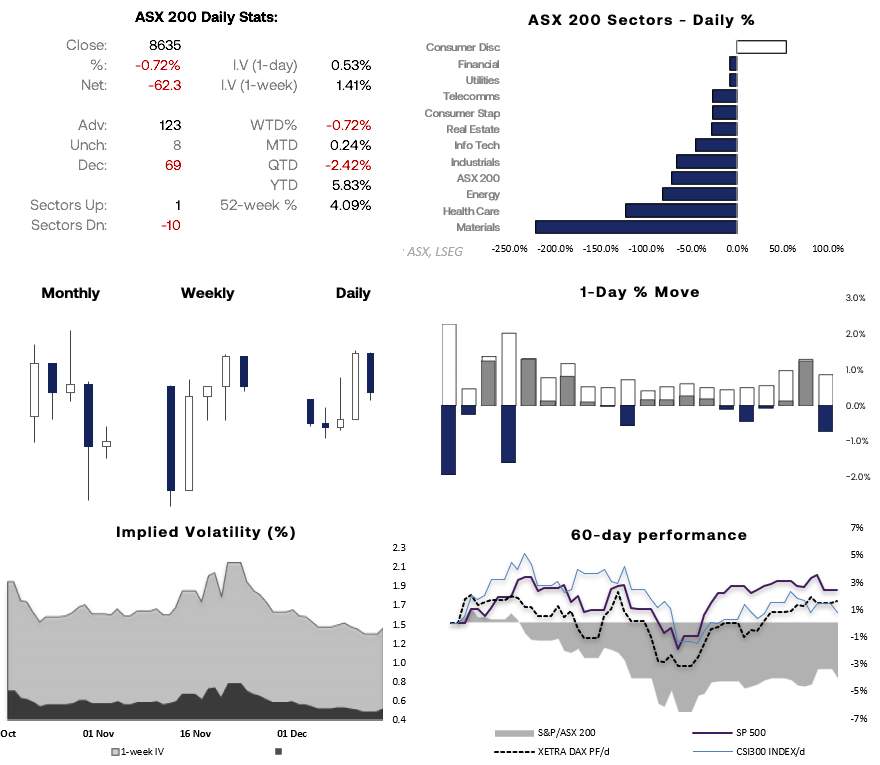
Chart analysis by Matt Simpson - source: ASX, LSEG

ASX 200 Futures (SPI 200) Sector
Price action across the ASX remains choppy and largely range-bound, but with a slight bullish bias. Friday’s 1.5% gain marked its strongest daily performance since April, and the current consolidation is holding above the 200-day SMA, while price continues to oscillate around the 200-day EMA. The daily RSI (14) is also trending modestly higher, consistent with a stabilising market.
The pullback from last week’s high is holding above the high-volume node (HVN) of the prior consolidation, which could offer near-term support. That keeps the door open for bulls to make another attempt on the September low near 8,750. A clean break above that level would bring the November VPOC at 8,838 into focus.
Seasonality also remains supportive. The longer the ASX holds above key support levels into Christmas, the greater the odds of a Santa rally, with gains typically concentrated in the second half of December, particularly between Christmas Eve and New Year’s Eve.
That said, once any near-term rally plays out, I remain alert to the risk of a lower high forming. In that scenario, a break below 8,447 could see the ASX 200 rotate lower toward the support cluster around 8,200.

Chart analysis by Matt Simpson - Source: TradingView, ASX SPI 200 Index Futures
View the full economic calendar
-- Written by Matt Simpson
Follow Matt on Twitter @cLeverEdge
How to trade with City Index
You can trade with City Index by following these four easy steps:
- Open an account, or log in if you’re already a customer
• Open an account in the UK
• Open an account in Australia
• Open an account in Singapore
- Search for the market you want to trade in our award-winning platform
- Choose your position and size, and your stop and limit levels
- Place the trade


