


The ASX 200 slipped for a second consecutive session as tariff-driven headlines continued to weigh on risk appetite, leaving bulls unable to reclaim ground above 8900. While the broader index remains trapped in a choppy range, two heavyweight stocks are now flashing independent bearish technical signals.
Commonwealth Bank (CBA) is pressing against critical support near 150, with Australian financials exposed to higher-for-longer rate risks and rising geopolitical uncertainty. Meanwhile, Rio Tinto (RIO) is showing early signs of a corrective pullback following a powerful multi-month rally, raising the risk of near-term downside despite its broader uptrend.
With headline risk elevated around Trump, tariffs and Davos, volatility spikes remain possible. However, unless the ASX 200 accepts away from the 8800 region, mean reversion remains the default near-term expectation rather than trend.
View related analysis:
- Apple (AAPL) Q4 Earnings Preview: Services in Focus as iPhone Growth Slows
- Tesla (TSLA) Earnings Preview: Q4 Margins in Focus
- ASX 200 Market Outlook: Materials Surge, CBA Support Defies Bears
- ASX 200 Market Outlook: Consumer Stocks Rebound, Coles (COL) Rallies
- ASX 200 Market Outlook: CBA Holds Firm as Banks Attempt to Stabilise
ASX 200 Outlook: Key Support Levels in Focus for CBA and RIO
ASX 200 Market Snapshot
- The ASX 200 fell for a second day on Tuesday as Trump’s tariff threats weighed on sentiment
- The -58.6 point (-0.66%) decline marked the worst session in 23 days after bulls failed to reclaim 8900
- Financials (XFJ) fell -1.1% and Materials (XMJ) led seven declining sectors lower, while Utilities (XUJ) (+1.5%) and Technology (XIJ) (+0.9%) led four advancing sectors
- ASX options positioning points to a short-term magnet around 8800, with relatively balanced call and put open interest near Tuesday’s close
- With headline risk elevated, volatility spikes remain possible, but unless price accepts away from 8800, the bias favours choppy, two-way price action rather than trend
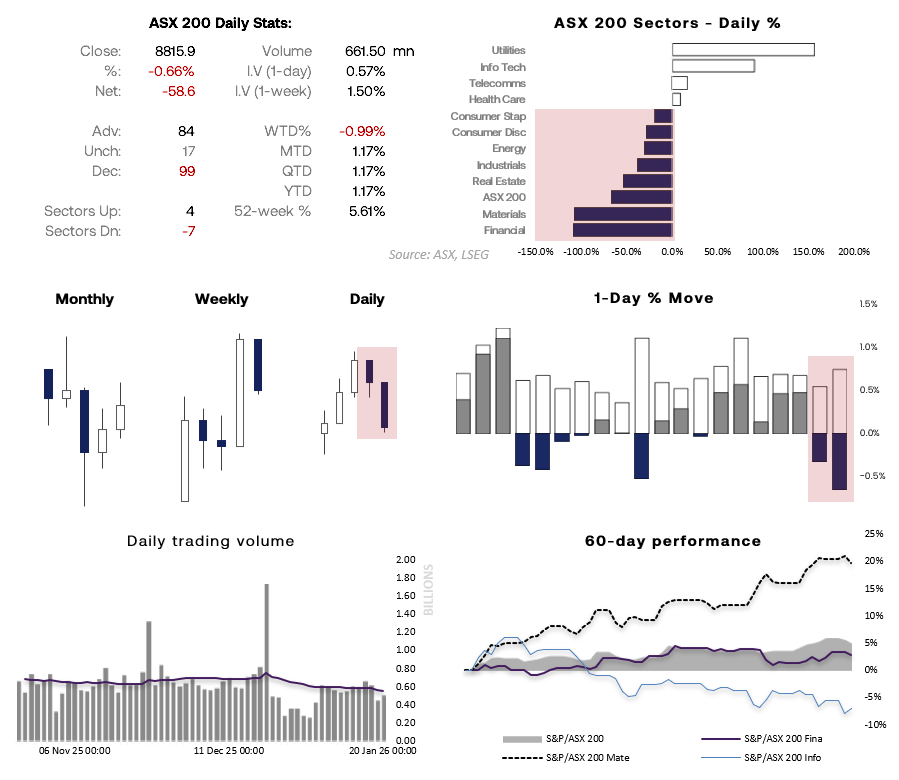
Source: ASX, LSEG

Commonwealth Bank (CBA) Share Price Technical Analysis
I have outlined my bearish bias for the Australian financials sector several times in recent weeks, driven by a deteriorating price structure, the risk of further RBA hikes, and rising geopolitical risk. While I had pencilled in at least a minor bounce in CBA shares from the 152 level, price action fell short of even my least bullish expectations.
Instead, CBA fell for a second consecutive session, closing near its lowest level since April and sitting on the cusp of a decisive break below the 150 handle.
This is not a textbook head-and-shoulders top, but the daily chart structure is clearly bearish. With little obvious support until the 140 area, volatility could pick up sharply if CBA delivers a clean break below 150.
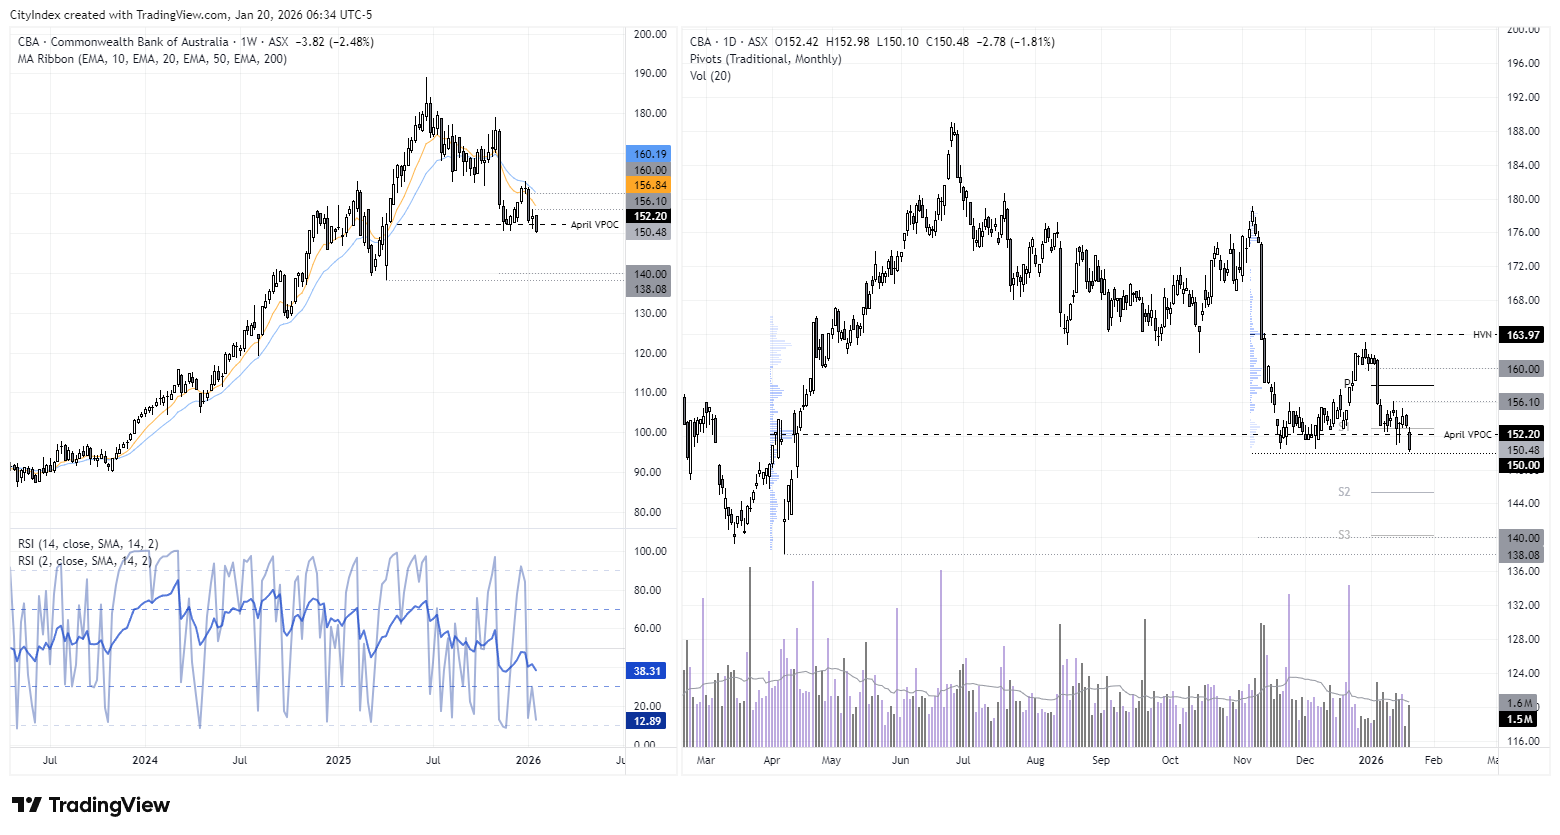
Source: ASX, TradingView

Rio Tinto (RIO) Share Price Technical Analysis
Rio Tinto’s share price has more than doubled since its June low, confirming a strong medium-term uptrend. However, a bearish outside week just below 156 in January drained bullish momentum, and the stock has yet to fully recover. That week also printed a large upper wick, signalling sharp rejection of higher prices — reinforced by a ~$4 downside gap on elevated volume on the daily chart.
While RIO found support at the 10-week EMA and rebounded last week, Tuesday’s bearish engulfing candle warns of a potential swing high forming within that gap. This raises the risk that Rio Tinto is entering a classic ABC corrective phase rather than resuming its prior trend.
- A move below 146 would break the 20-day EMA and bearish-engulfing low
- 140 is the key interim downside target, aligning with cycle lows, the 50-day EMA, and the 61.8% Fibonacci projection
- A break below 140 would bring 136 into focus, near the October high and a Fibonacci cluster
- A sustained break back above 150 would invalidate the near-term bearish bias
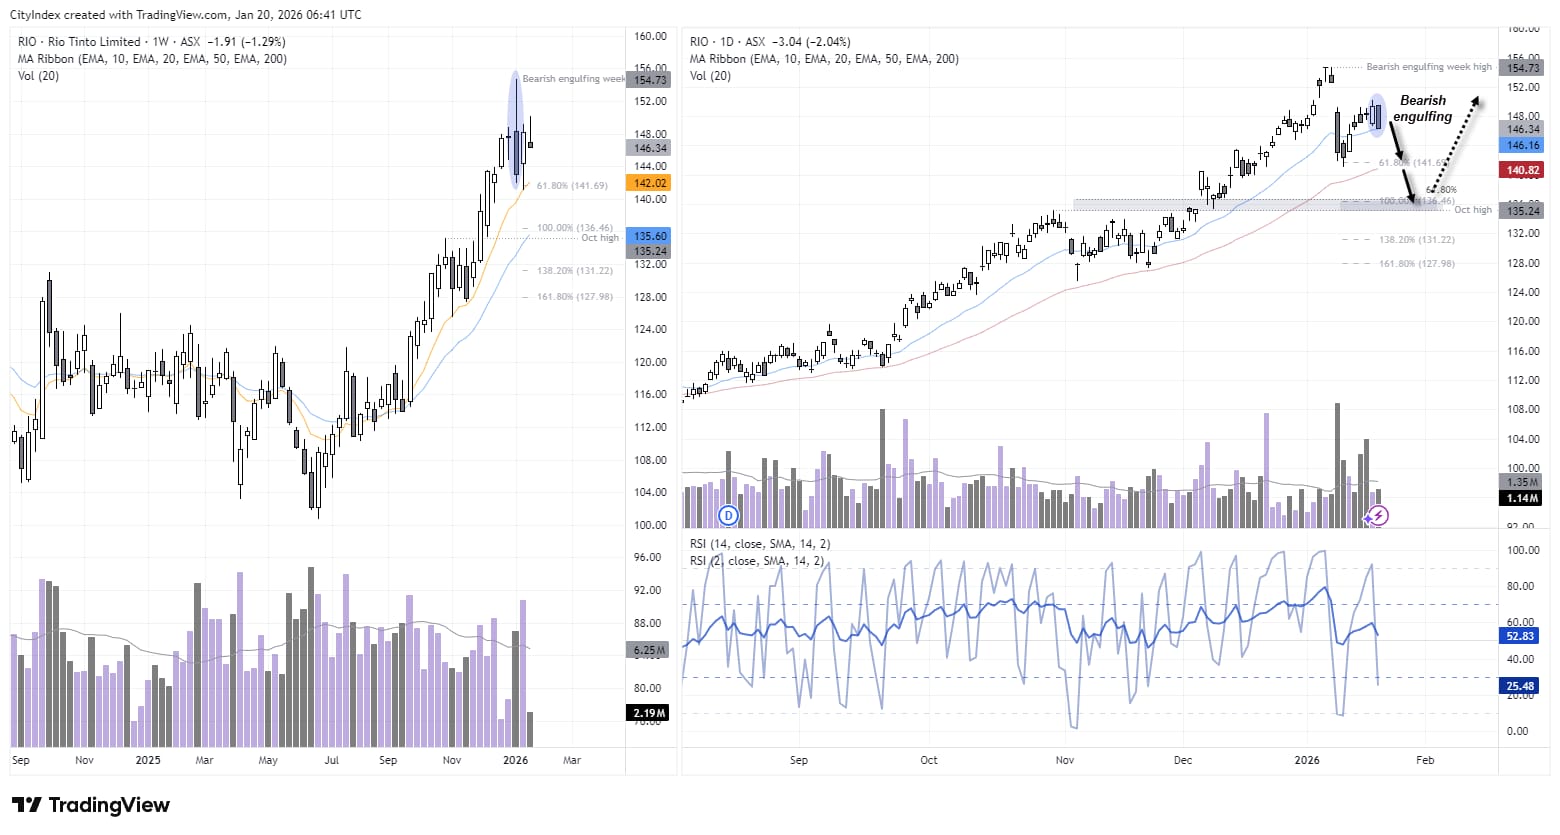
Source: ASX, TradingView
View the full economic calendar
-- Written by Matt Simpson
Follow Matt on Twitter @cLeverEdge
How to trade with City Index
You can trade with City Index by following these four easy steps:
- Open an account, or log in if you’re already a customer
• Open an account in the UK
• Open an account in Australia
• Open an account in Singapore
- Search for the market you want to trade in our award-winning platform
- Choose your position and size, and your stop and limit levels
- Place the trade


