


The ASX 200 found some footing on Tuesday after Monday’s shaky start, but conviction remains low with the index still trading under its 200-day average. Sector breadth was mixed and volatility stayed compressed, hinting at indecision ahead of the key December period. Healthcare led the improvement last week, yet its rebound remains patchy, with CSL, PME and SHL moving in different directions. With seasonality set to become more supportive from mid-December, traders will be watching whether this week brings follow-through or a renewed slip in momentum.
View related analysis:
- ASX 200 Market Outlook: Can Santa’s Rally Help the ASX This December?
- ASX 200 Market Outlook: NAB Teases Bears as Financials Form a Bear Flag
- ASX 200 Market Outlook: FMG Eyes Breakout, WOW Firms Up
- ASX 200 Market Outlook: Industrials Lead Rebound, Brambles BXB Perks Up
Healthcare Rebound Remains Mixed
ASX 200 Market Snapshot
- The Australian share market stabilised on Tuesday after a shaky start to the month.
- A bullish inside day and a potential inverted hammer formed, although the ASX 200 cash index remains below its 200-day SMA (5891.8).
- The narrow trading range — the smallest in 11 weeks — also highlights a lack of conviction from both sides.
- Near-term risks still tilt lower following last week’s swing high, but as discussed in Tuesday’s report, the seasonal case for a Santa rally strengthens from mid-December.
- Six of eleven ASX sectors finished lower, led by Information Technology (XIJ) and Utilities (XUJ). Energy (XEJ) and Materials (XMJ) outperformed on the day.
- Financials (XFJ) saw selling pressure ease, and CBA continues to hold above 150 and its 20-month EMA — a key level for broader ASX sentiment.
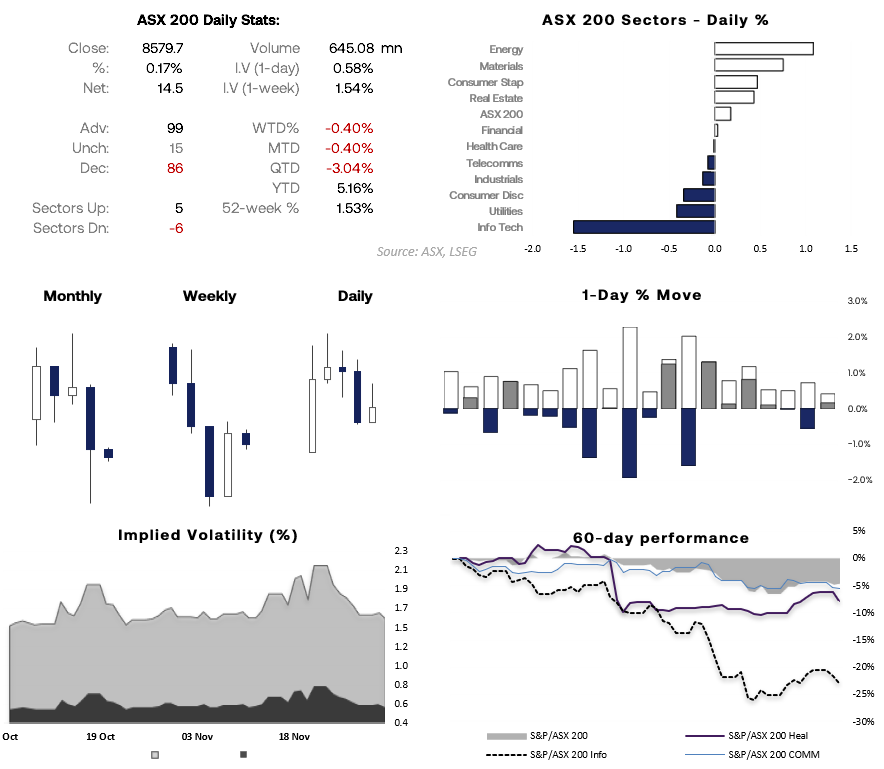
Chart analysis by Matt Simpson - source: ASX, LSEG

ASX 200 Correlations
- The 10-day correlation between the financials index and the broader market is effectively zero at -0.11, suggesting the 150 level on CBA may not carry the same weight it once did.
- Materials remain well-aligned with the index over the 10-day lookback at 0.73.
- Broader risk correlations stay firm, with the ASX 200 tracking closely with the DAX (0.93), Nikkei (0.91) and S&P 500 (0.87).
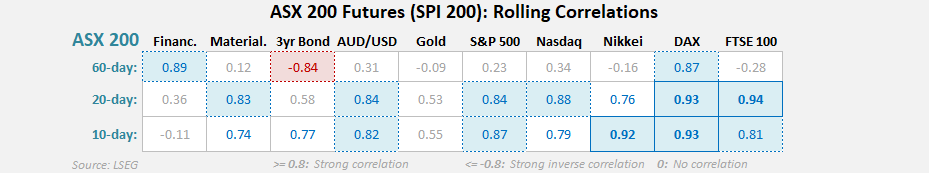
Chart analysis by Matt Simpson - source: ASX, LSEG
ASX 200 Healthcare (XHJ) Rebound Could be Limited
The healthcare sector (XHJ) posted its best week in eight after finding support above the 2023 low. Near-term oversold conditions helped, but the broader bearish backdrop remains. XHJ has now retraced around half of last week’s bullish engulfing candle, so the next few sessions will show whether buyers can build on this. Seasonality could lend support in the second half of December, but the sector may struggle unless key constituents start to turn higher.
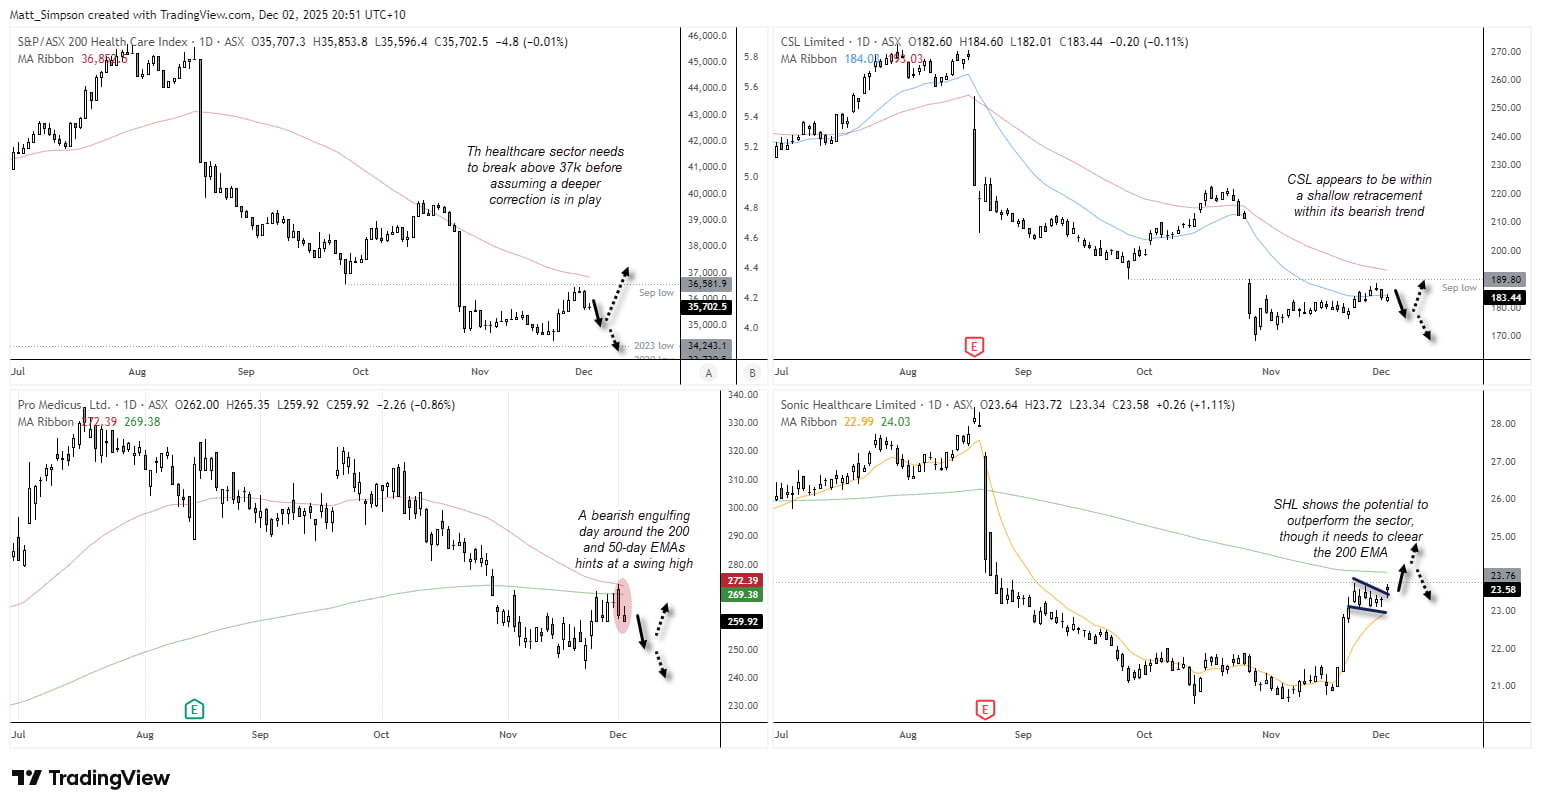
ASX 200 Healthcare sector (XHJ) chart with CSL, Pro Medicus (PME) and Sonic Healthcare (SHL) technical analysis showing bearish trends, key EMAs, swing-high signals and potential SHL breakout – source: TradingView.
Chart analysis by Matt Simpson - source: ASX, LSEG

CSL Retains a Bearish Bias
CSL, the sector heavyweight, remains structurally bearish. The recovery from the October low still looks corrective, with price capped below the September low and the 50-day EMA. Bears will be watching for momentum to roll over towards the 160 target, near the November 2018 low (158.43). A break above 190 would imply a deeper retracement, but the downside target stays intact unless the broader trend changes.
Pro Medicus (PME) Hints at Swing High
PME remains in a downtrend, and Monday produced a bearish engulfing candle around the 50-day and 200-day EMAs — a pattern that often precedes a swing high.
Sonic Healthcare (SHL)
SHL is the only major healthcare name showing early signs of potential outperformance. After a multi-week consolidation, price broke above $22 before forming a bull flag. Momentum extended on Tuesday, hinting at a breakout. Bulls will want to see a clean move above the April low (23.76) and the 200-day EMA (~24) to confirm the trend shift.
View the full economic calendar
-- Written by Matt Simpson
Follow Matt on Twitter @cLeverEdge
How to trade with City Index
You can trade with City Index by following these four easy steps:
- Open an account, or log in if you’re already a customer
• Open an account in the UK
• Open an account in Australia
• Open an account in Singapore
- Search for the market you want to trade in our award-winning platform
- Choose your position and size, and your stop and limit levels
- Place the trade


