


It has been a decent start to the year of the ASX 20 so far, pressing toward the 8900 handle as sector leadership remains firmly with materials. Strength in base metals, iron ore and gold is doing the heavy lifting, allowing the index to advance even as correlations with financials weaken.
At the stock level, Commonwealth Bank stands out for a different reason. Despite growing expectations that higher interest rates will pressure the financial sector later this year, CBA continues to hold key support. That divergence sets up an interesting near-term dynamic for both the index and its largest constituent.
View related analysis:
- Tesla (TSLA) Earnings Preview: Q4 Margins in Focus
- ASX 200 Market Outlook: Consumer Stocks Rebound, Coles (COL) Rallies
- Australian Dollar Price Action Setups: AUD/USD, AUD/JPY, EUR/AUD
- ASX 200 Market Outlook: CBA Holds Firm as Banks Attempt to Stabilise
ASX 200 Market Snapshot
- The ASX 200 rose for a fourth consecutive session on Thursday, closing at an eight-week high, with 8900 now in focus for bulls
- Options activity is skewed to the upside, with a one-week call cluster at 8900, 8950 and 9000 (8950 dominant)
- Six of the 11 ASX 200 sectors advanced, led by Materials (XMJ), Healthcare (XHJ) and Financials (XFJ)
- Five of the 11 ASX 200 sectors declined, led by Information Technology (XIJ), Utilities (XUJ) and Telecoms (XTJ)
- Materials (XMJ) hit a fresh record high, supported by a strong rally in base metals and record iron ore imports from China; BHP rose 2.3% to a two-year high
- Energy (XEJ) remains the strongest-performing sector this year, underpinned by the rebound in crude oil prices
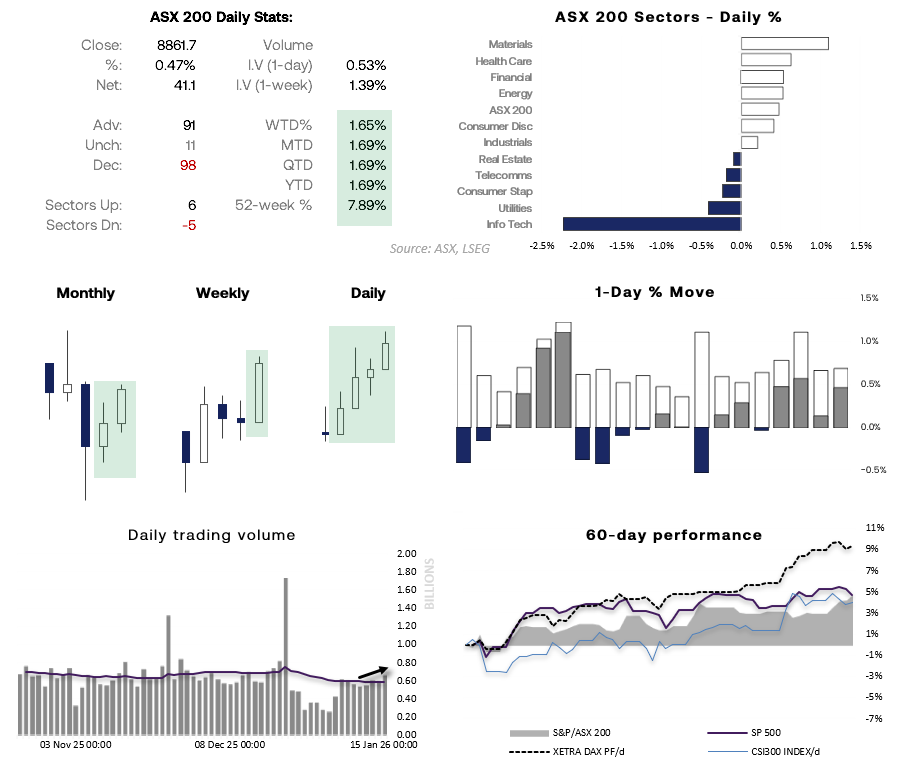
Chart analysis by Matt Simpson - source: ASX, LSEG

ASX 200 Correlations
Notice how the industry-standard 20-day correlation between the ASX 200 and the financials sector has effectively broken down, signalling a decoupling in their relationship. But with CBA defiantly holding support, it may at least see a bounce before anticipated losses resume. Moreover, the correlation between XFJ and the ASX 200 is now a strong 0.86, which could help pull the 20-day measure back into positive territory.
The materials sector — the second-largest ASX sector by market capitalisation — remains especially strong over the 10-day window and relatively firm over the 20-day. This suggests the ASX 200 is taking its lead from rising base metal prices and improved iron ore sentiment. The strong correlation with gold is also notable, and unlikely to be coincidental.
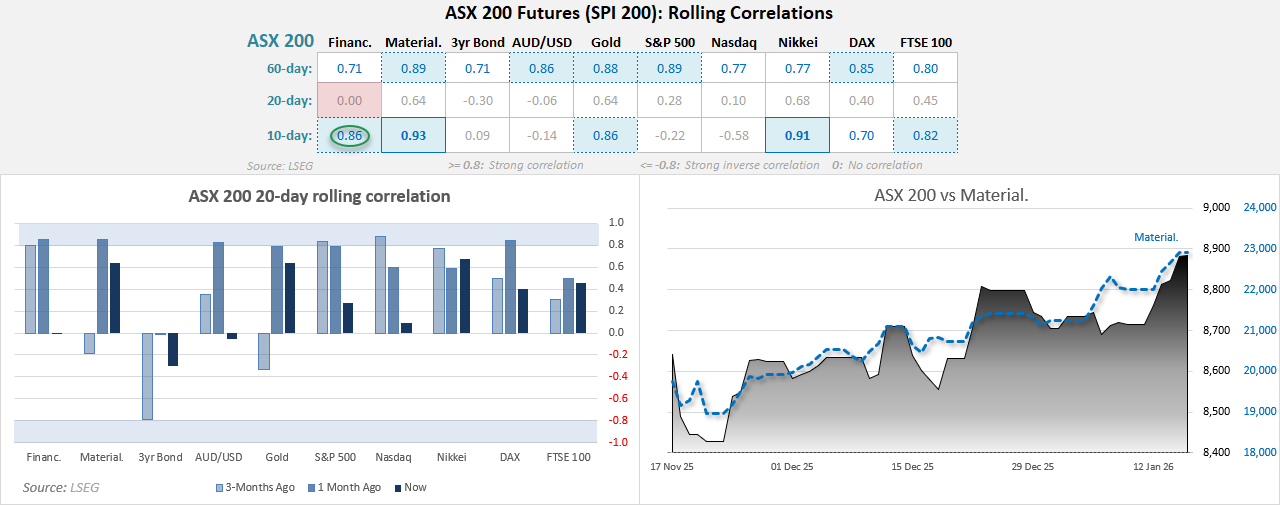
Chart analysis by Matt Simpson - source: ASX, LSEG

Commonwealth Bank (CBA) Technical Analysis
While I maintain my view that the financial sector will face further pressure this year as the threat of Reserve Bank of Australia (RBA) hikes builds, that doesn’t mean banking stocks will fall in a straight line. In fact, CBA is doing a fine job of stifling bearish hopes by stubbornly refusing to test — let alone break below — 150.
Given the ASX 200 is rising without its largest stock by market capitalisation, CBA may be building towards a near-term bounce.
The weekly chart shows CBA on track to form a spinning top doji at current levels. The overlay also highlights the ASX 200 advancing without CBA while the stock continues to hug support.
On the daily chart, prices are holding above the April VPOC (volume point of control), while a bullish divergence has formed on the RSI (2). Despite heavy volume on Wednesday, support has held, and a small bullish pin bar on Thursday hints at early demand returning.
The near-term bias favours a bounce while price holds above recent swing lows. A break above 156.10 opens a run towards 160, although this would be counter-trend, so bulls may want to stay nimble. Alternatively, bears can remain patient and look for bearish reversal signals at higher levels.
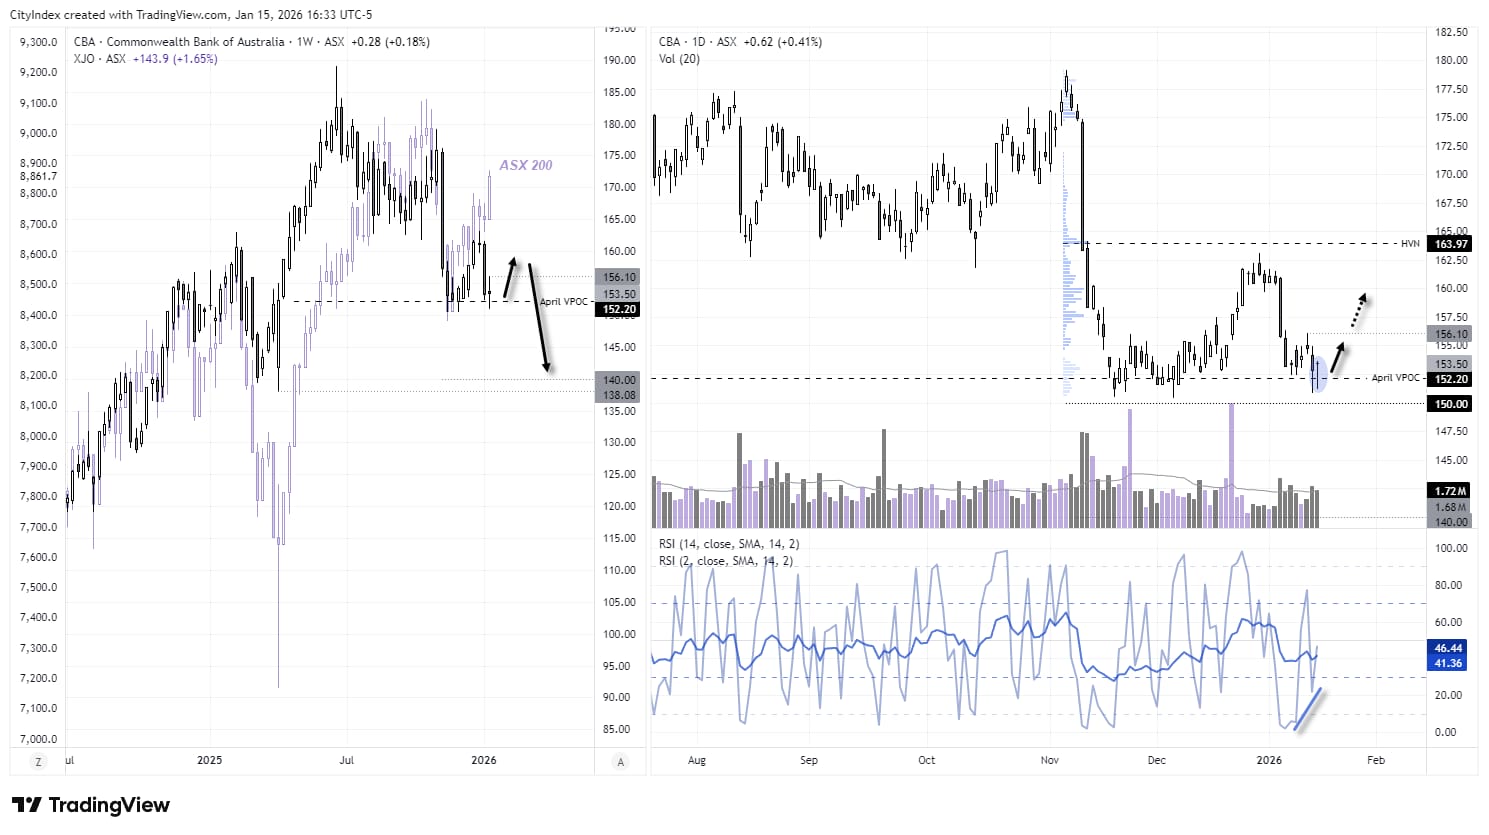
Chart analysis by Matt Simpson - Source: TradingView, ASX SPI 200 Index Futures
View the full economic calendar
-- Written by Matt Simpson
Follow Matt on Twitter @cLeverEdge
How to trade with City Index
You can trade with City Index by following these four easy steps:
- Open an account, or log in if you’re already a customer
• Open an account in the UK
• Open an account in Australia
• Open an account in Singapore
- Search for the market you want to trade in our award-winning platform
- Choose your position and size, and your stop and limit levels
- Place the trade


