The ASX 200 closed at a fresh record high despite renewed bets of an RBA hike, as investors focused on a resilient domestic economy and strong banking profits. A 1.2% gain marked the index’s best session in two weeks and left a Morning Star reversal pattern on the daily chart.
But while momentum remains constructive, options positioning suggests 9,125 could prove decisive in the near term.
View related analysis:
- Australian Dollar Firms After CPI Keeps RBA on Tightening Track
- Gold Price Outlook: Are Options Traders Front-Running a Breakout?
- ASX 200 Market Outlook: Record High Rejected as Gold Sector Breaks Out
- FX Futures Positioning: US Dollar, GBP, JPY, AUD | COT report
ASX 200 Tests 9,125 as Record Rally Meets Gamma Resistance
ASX 200 Market Snapshot
- The ASX 200 cash index closed at a record high on Wednesday despite renewed bets of an RBA hike, as equity traders focused on a resilient economy and strong banking profits.
- Its 1.2% gain marked the best session in two weeks and left a Morning Star pattern (three-bar bullish reversal) on the daily chart at record highs.
- Materials (XMJ) led eight sectors higher as cyclical and mining stocks outperformed, while financials (XFJ) and technology (XIJ) also enjoyed a risk-on session.
- A strong earnings beat from Woolworths (WOW) saw the stock surge 13%, helping the consumer staples sector (XSJ) post its best day in six years with a 5.7% gain.
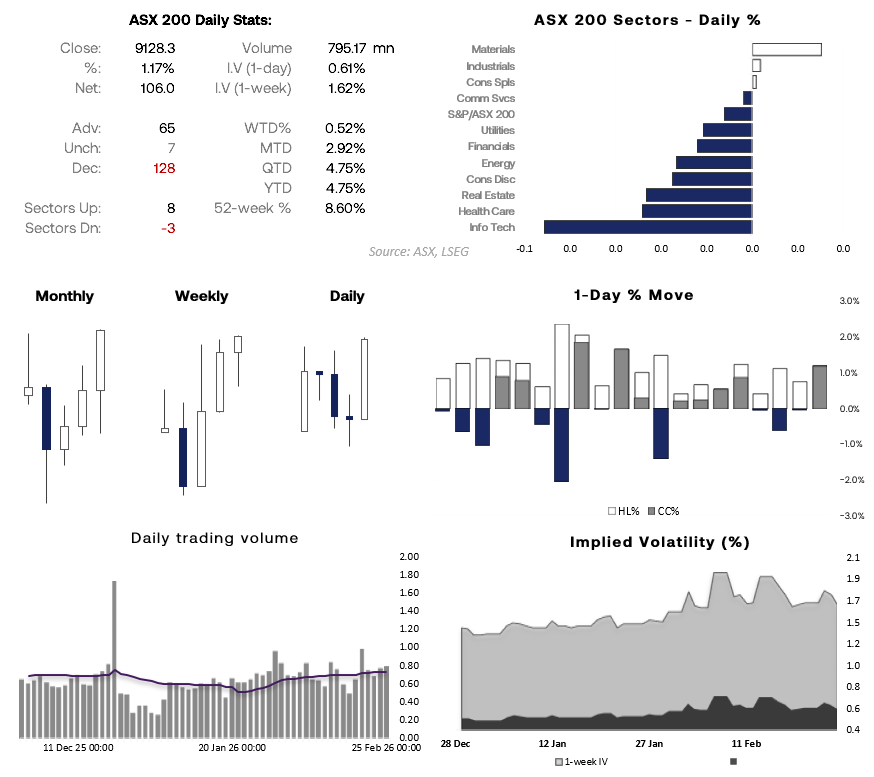
Source: ASX, LSEG

ASX 200 Technical Analysis
ASX 200 Options Positioning: 9,125 the Pivot as Gamma Clusters Tighten
ASX 200 gamma is tightly clustered between 9,100 and 9,125 for today’s expiry, which puts the index squarely in a dealer hedging zone. That typically promotes chop rather than clean trends.
- 9,125 is the key pivot — acceptance above it could open the door to 9,150 and potentially 9,175 next week.
- But if price slips back below 9,125, expect rotation toward 9,100 and possibly 9,000.
- In short, this is a break-and-hold market, not a chase-and-hope one.
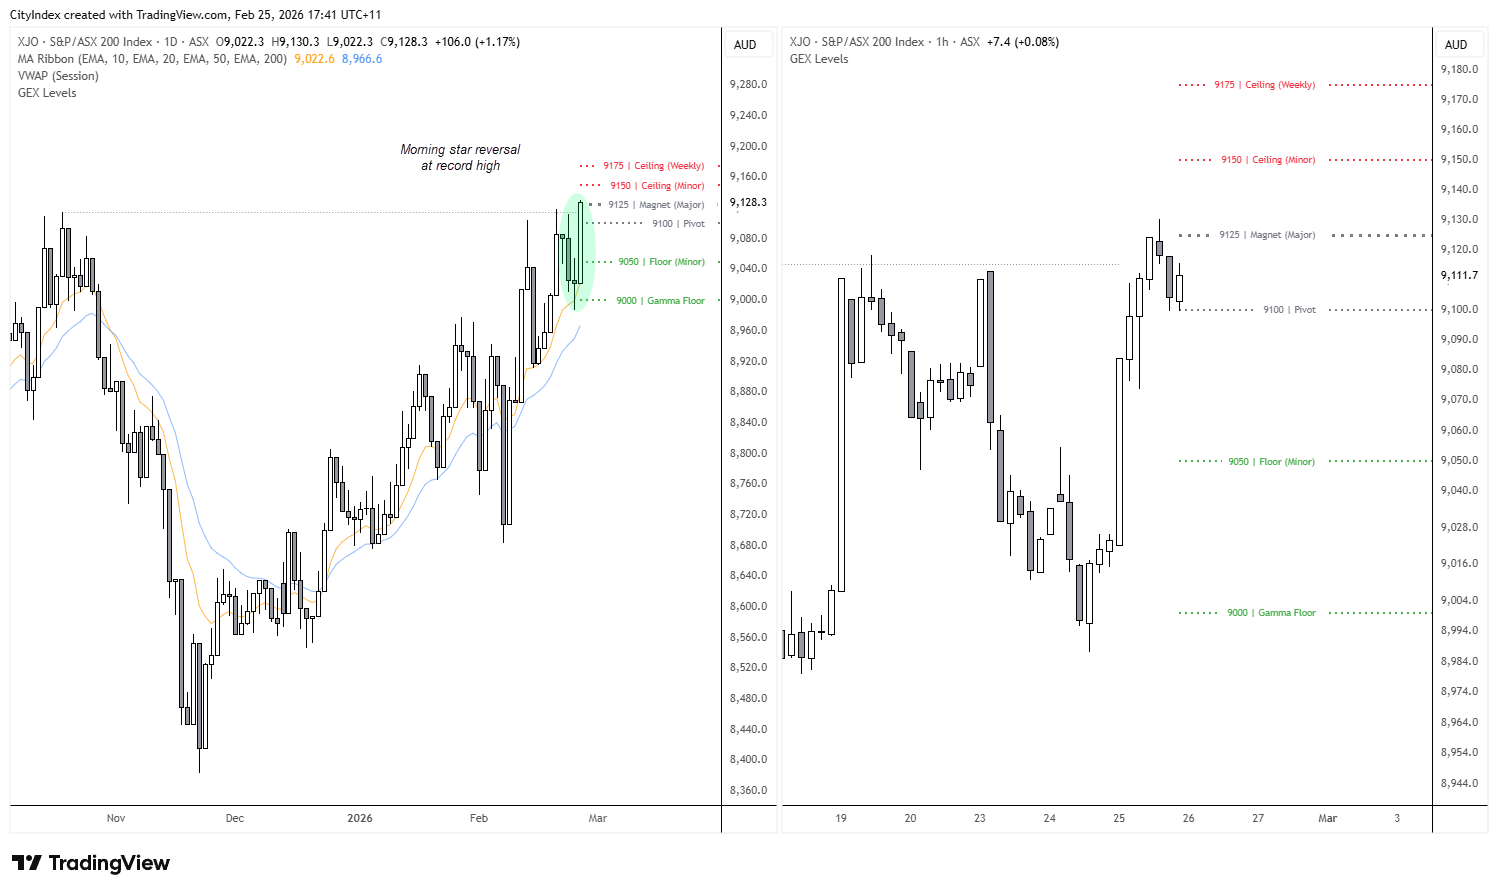
Source: ASX, TradingView
Indices

SPI 200 (ASX 200 Futures) Outlook
While Australia’s share market has reached a record high, the ASX 200 futures market has not. It needs to rise another 0.44% to test its all-time high set in October — and if it does, it could also stall the rally on the ASX 200 cash index.
With the ASX 200 cash market stalling around an important options cluster at 9,125, there is potential for a pullback in the futures market overnight. The 1-hour chart suggests a possible double top forming around 9,080, alongside a bearish divergence. I am not looking for a deep retracement given the strong close on the cash market, though we could see prices rotate towards 9,050 near the high-volume node (HVN).
It could be argued that prices are overextended from the weekly VPOC, but I see this more as a reference point for bulls to buy dips rather than a reason alone to seek shorts. Overall, it seems more likely than not that ASX 200 futures will attempt another run at a record high — pullback or not.
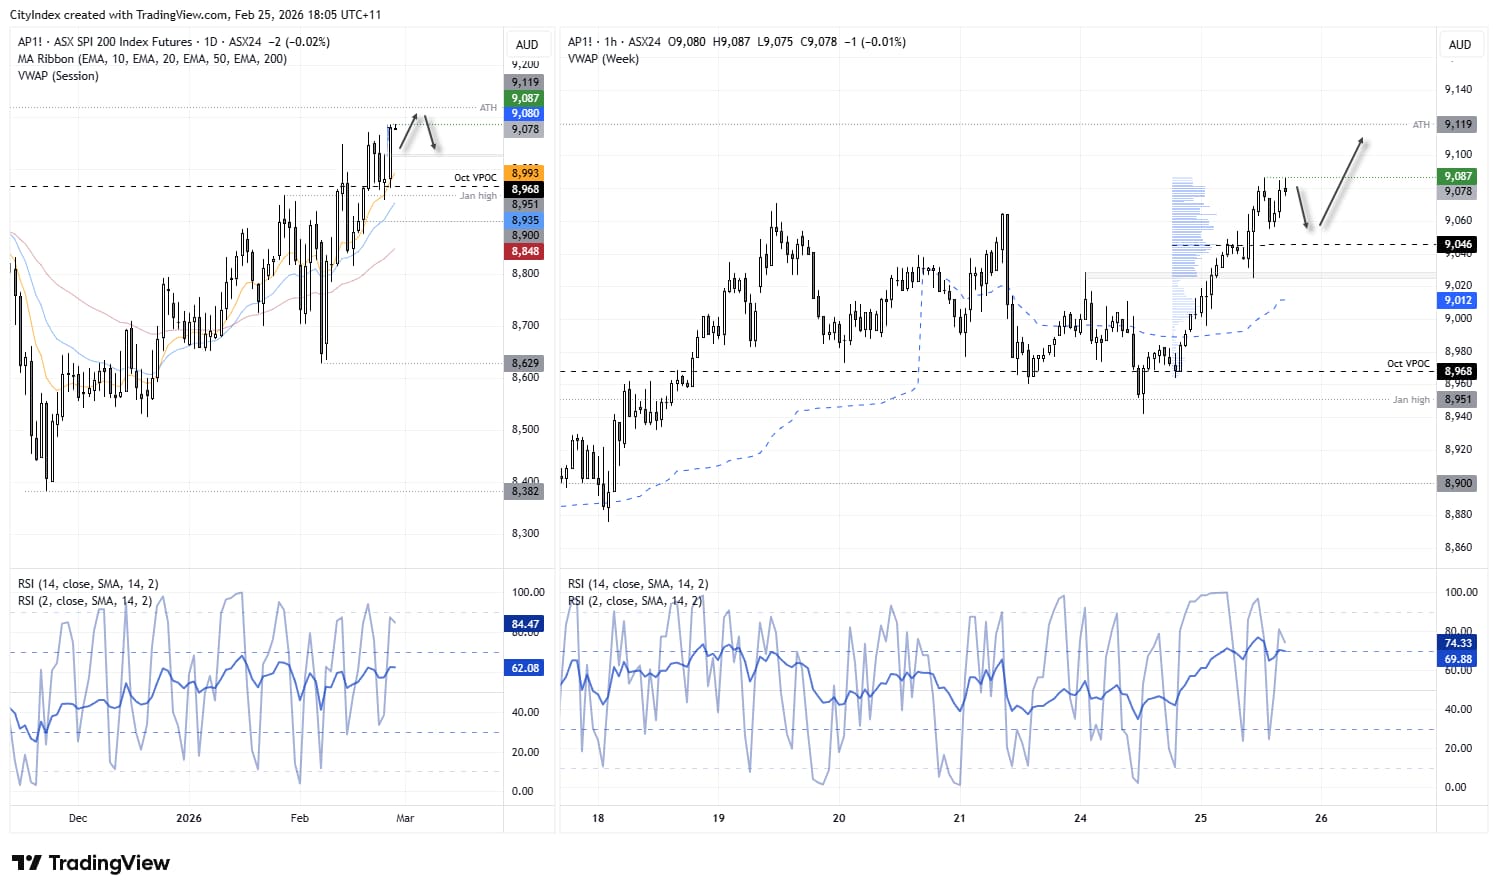
Source: ASX, TradingView
View the full economic calendar
-- Written by Matt Simpson
Follow Matt on Twitter @cLeverEdge
How to trade with City Index
You can trade with City Index by following these four easy steps:
- Open an account, or log in if you’re already a customer
• Open an account in the UK
• Open an account in Australia
• Open an account in Singapore
- Search for the market you want to trade in our award-winning platform
- Choose your position and size, and your stop and limit levels
- Place the trade