


The ASX 200 continues to grind higher, printing a fresh intraday record high before easing slightly into the close. Strong earnings, expanding participation and rising volumes reinforce the bullish structure. However, with price pressing record territory and a notable call cluster overhead, the next leg higher may require a decisive break through nearby resistance.
View related analysis:
- Australian Jobs Strong Enough to Keep RBA Alert, But Not Force Action
- Crude Oil Risk Premium Rises as US–Iran Tensions Escalate
- Nasdaq 100 Technical Analysis: Seasonal Weakness Meets Key Support
- ASX 200 Market Outlook: 9000 Becomes Key Battleground
ASX 200 Market Snapshot
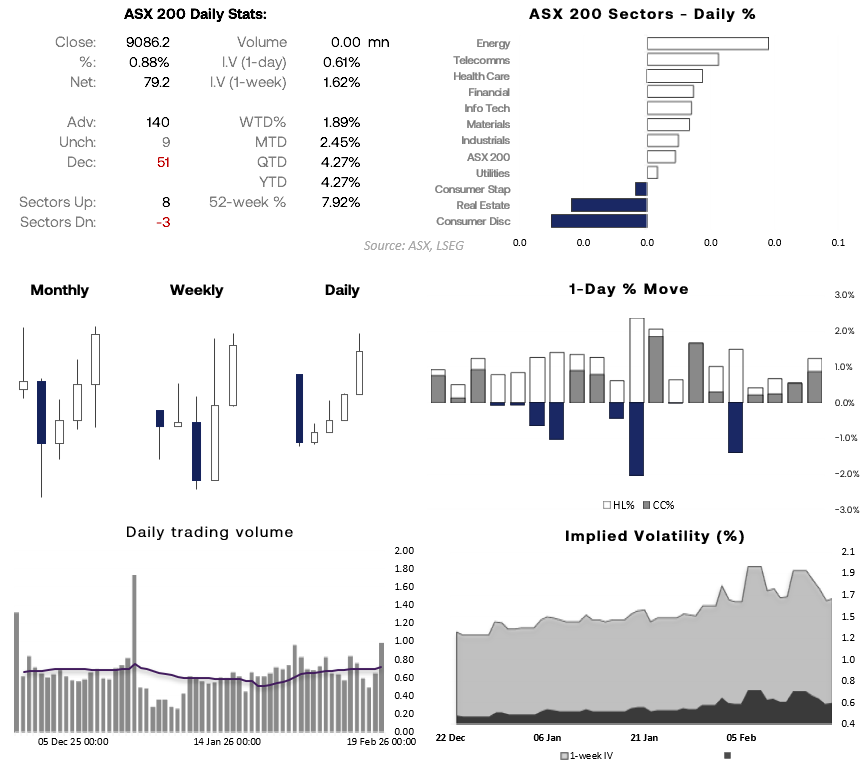
- A strong earnings season helped the ASX 200 post an intraday record high on Thursday, although it pared gains into the close to finish just shy of its all-time high.
- The move had breadth behind it, with 140 ASX 200 stocks advancing, 51 declining and 9 unchanged.
- Daily trading volume was the highest since mid-December, suggesting bullish participation behind the rally.
- The financials sector (XFJ) hit a record high, with CBA, NAB and ANZ advancing among the ASX heavyweights.
- The energy sector (XEJ) reached its highest level since October 2024, tracking crude oil prices amid US–Iran talks in Geneva, while Woodside Group (WDS) hit a 10-month high.
- It was the best session since April for the communication services sector (XTJ), with Telstra Group (TLS) reaching a record high.
Source: ASX, LSEG

ASX 200 Correlations
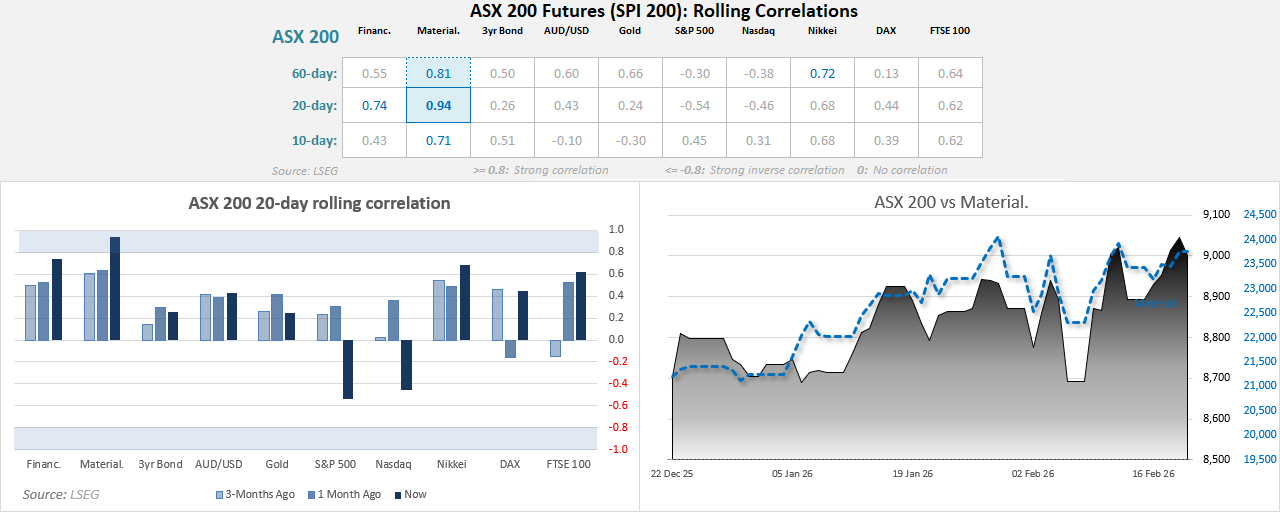
The ASX 200 remains most tightly linked to domestic cyclicals. The 20-day rolling correlation is strongest with Materials (0.94) and Financials (0.74), reinforcing the importance of commodities and bank performance in sustaining upside momentum. Correlations with the Nikkei and FTSE 100 are moderate, while short-term correlations with the S&P 500 and Nasdaq have turned negative.
Source: ASX, LSEG
ASX 200 Technical Analysis
Options Positioning Flags 9125 as Key Upside Barrier
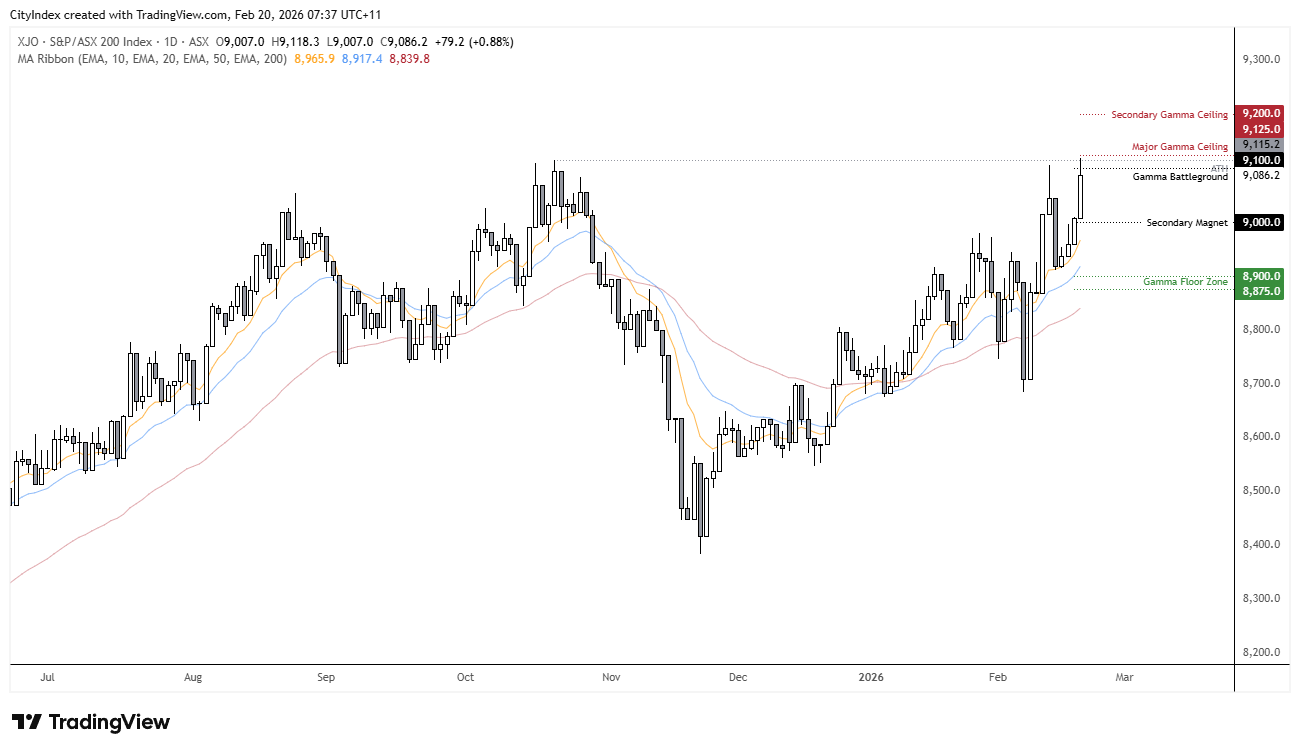
The ASX 200 closed at 9,086.2, placing price above the 9,000 magnet and beyond the 9,075 breakout level. The immediate battleground sits near 9,100, where balanced call and put open interest may promote short-term consolidation.
- If pullbacks hold above 9,075, the path of least resistance favours a test of 9,125 — the largest call cluster and primary gamma ceiling this week.
- A sustained break and acceptance above 9,125 would expose 9,200.
- A move back below 9,075 would likely rotate price toward the 9,000 magnet.
Source: ASX, TradingView
SPI 200 (ASX 200 Futures) Technical Analysis
The daily SPI chart reflects a firm uptrend despite a sharp whipsaw ahead of the latest leg higher. The speed with which buyers absorbed that pullback underscores underlying demand.
Although SPI futures traded softer overnight, nearby support levels could attract dip buyers. The September VPOC aligns with the monthly R1 pivot near 8,968, while the 10- and 20-day EMAs cluster around the 8,900 handle.
Some consolidation may unfold near record highs, but the broader bias favours a break above 9,119. A sustained move through that level would bring 9,200 into focus.
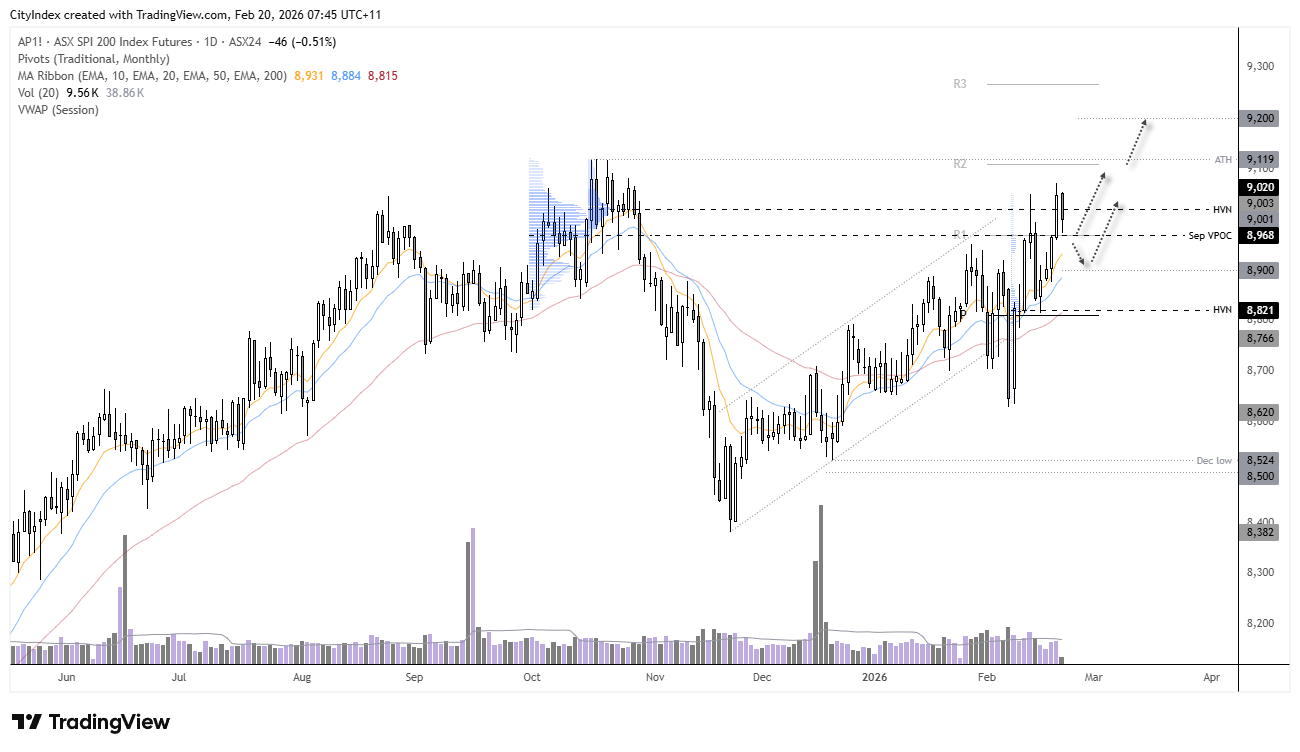
Source: ASX24, TradingView
View the full economic calendar
-- Written by Matt Simpson
Follow Matt on Twitter @cLeverEdge
How to trade with City Index
You can trade with City Index by following these four easy steps:
- Open an account, or log in if you’re already a customer
• Open an account in the UK
• Open an account in Australia
• Open an account in Singapore
- Search for the market you want to trade in our award-winning platform
- Choose your position and size, and your stop and limit levels
- Place the trade


