


The ASX 200 staged its strongest session since April at the start of the week, with technology stocks leading a broad-based rebound as risk appetite improved across Asia and Wall Street. The move has challenged the near-term bearish narrative, but it has not yet invalidated it.
Beneath the surface, sector leadership remains narrow, correlations continue to favour materials, and key technical resistance looms overhead. With SPI 200 futures drifting back toward the 8,900 region, the coming sessions may determine whether the rebound develops into something more durable or fades as another corrective bounce.
View related analysis:
- Australian Dollar Outlook: Rates Lead AUD/USD, Options Signal Risk
- ASX 200 market Outlook: Options Signal Choppy Trade Near 9,000
- Nasdaq 100 Outlook: Earnings Strength Meets Technical Resistance
- FX Futures Positioning: US Dollar, EUR/USD, USD/CAD | COT report
ASX 200 Rebound Tests Resistance as Sector Leadership Narrows
ASX 200 Market Snapshot
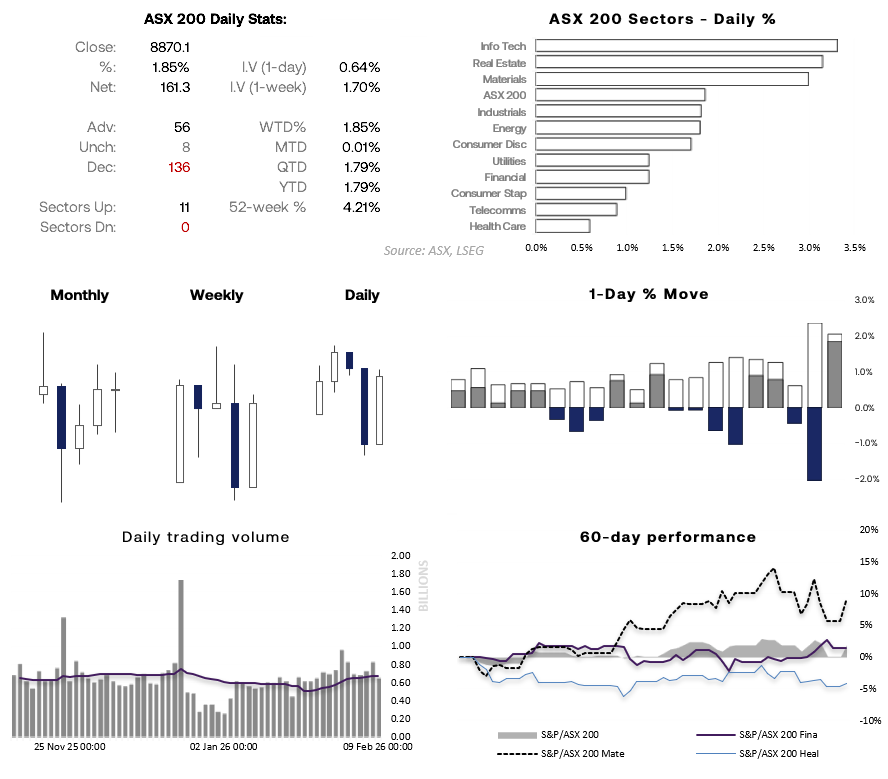
- The ASX 200 surged 2% on Monday, marking its strongest session since April, supported by firmer Asian sentiment and a Wall Street rebound late last week
- All 11 ASX sectors advanced, led by Information Technology (+3.3%), Real Estate (+3.1%), and Materials (+3.0%)
- SPI 200 futures extended gains by around 0.3% overnight, tracking strength in US tech stocks as the Nasdaq rose 0.8%
- Trading volumes have trended higher in recent weeks, although Monday’s rebound printed below-average turnover and the lowest in three weeks, suggesting sellers may still retain a slight edge
Source: ASX, LSEG

ASX Tech Rebound Looks Corrective, Not a Trend Shift
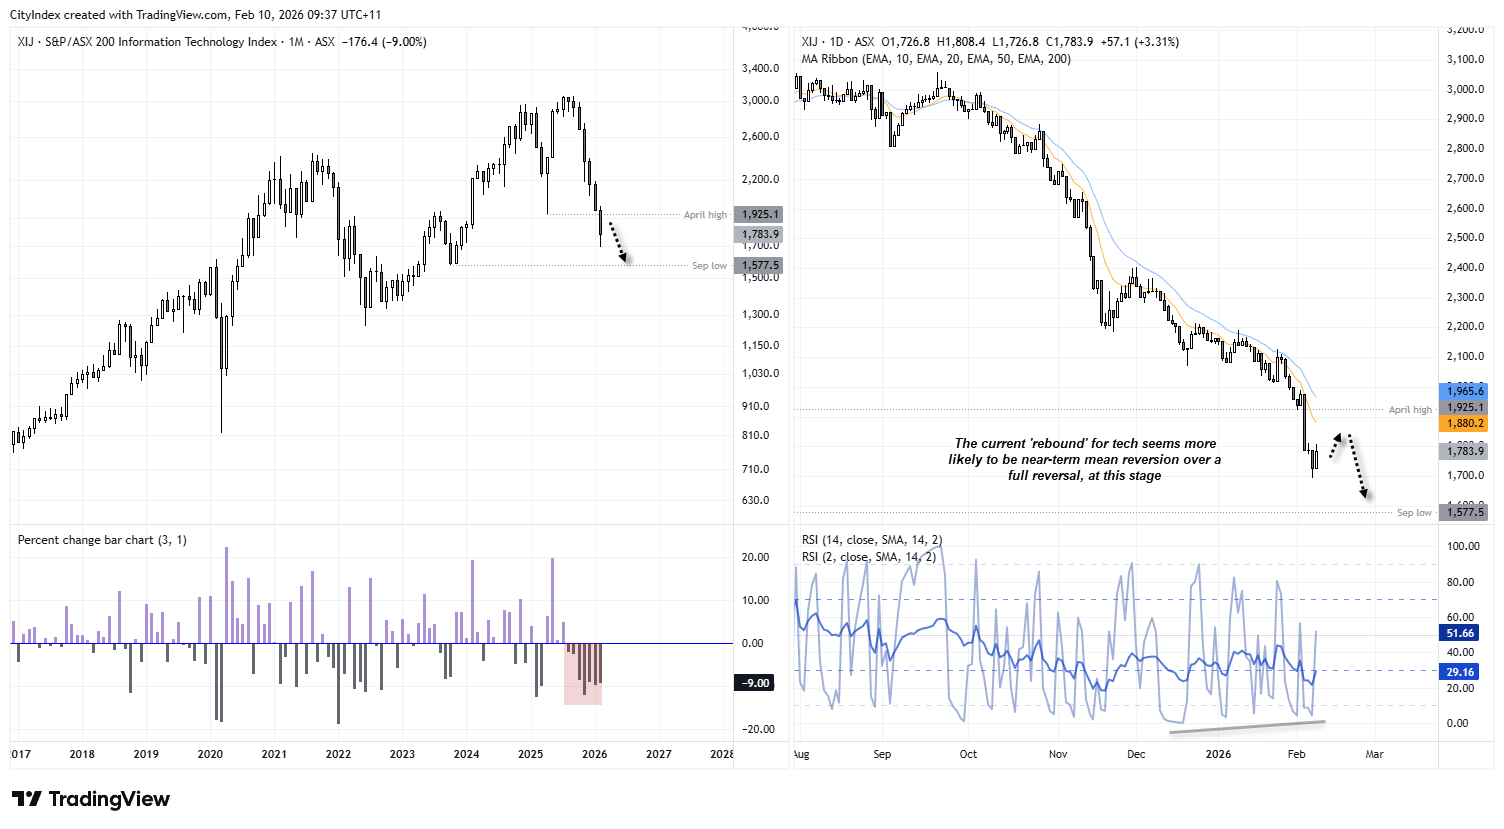
While Monday’s turnaround was welcomed by ASX tech bulls, it is little more than a drop in the ocean relative to recent losses. The ASX Information Technology sector (XIJ) has fallen as much as 44% from its record high in April and is on track for a seventh consecutive bearish month.
With only marginal signs of recovery, the move looks more like much-needed mean reversion at this stage rather than a true bullish reversal. The daily chart also appears overextended from its 10- and 200-day EMAs, suggesting the sector may retrace towards 1,900 before bears re-emerge.
Source: ASX, TradingView
ASX 200 Correlations: Materials Tighten Grip on Index Direction
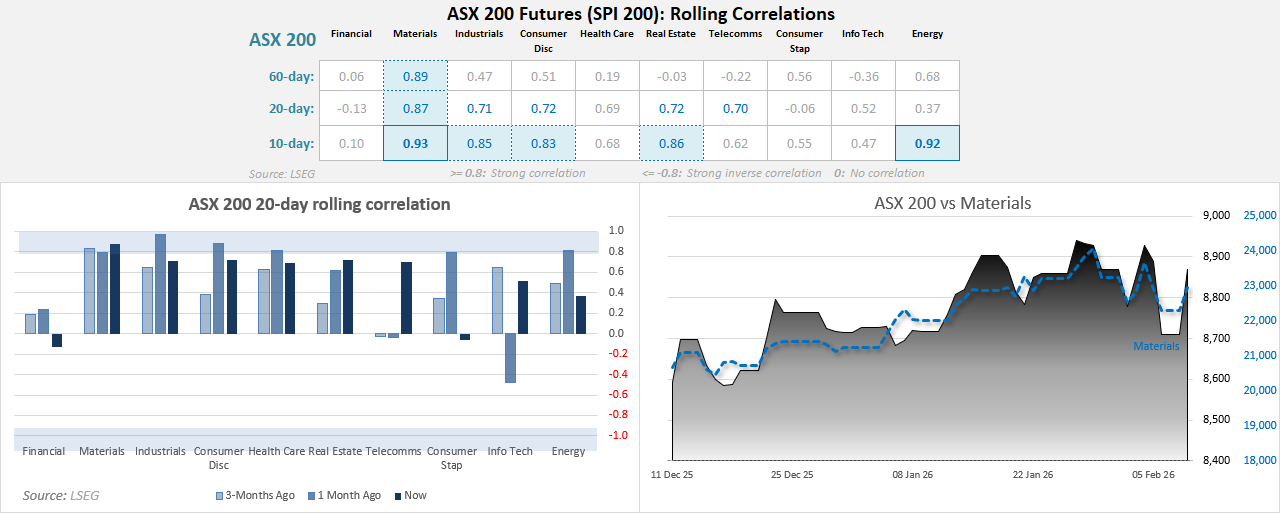
- Materials seems to be the bigger driver for the ASX at present, with a 10-day correlation of 0.93, 290-day at 0.87 and 60-days 0.89%
- This shows a solid relationship over multiple timeframes
- Industrials, consumer discretionary, real estate and energy have become more relevant over the past two weeks – leaving the question as to whether they’ll turn into more stable relationships on higher timeframes or go out of fashion once more
Source: ASX, LSEG

ASX 200 Rebound Clouds Bearish Case as 8,900 Comes Into Focus
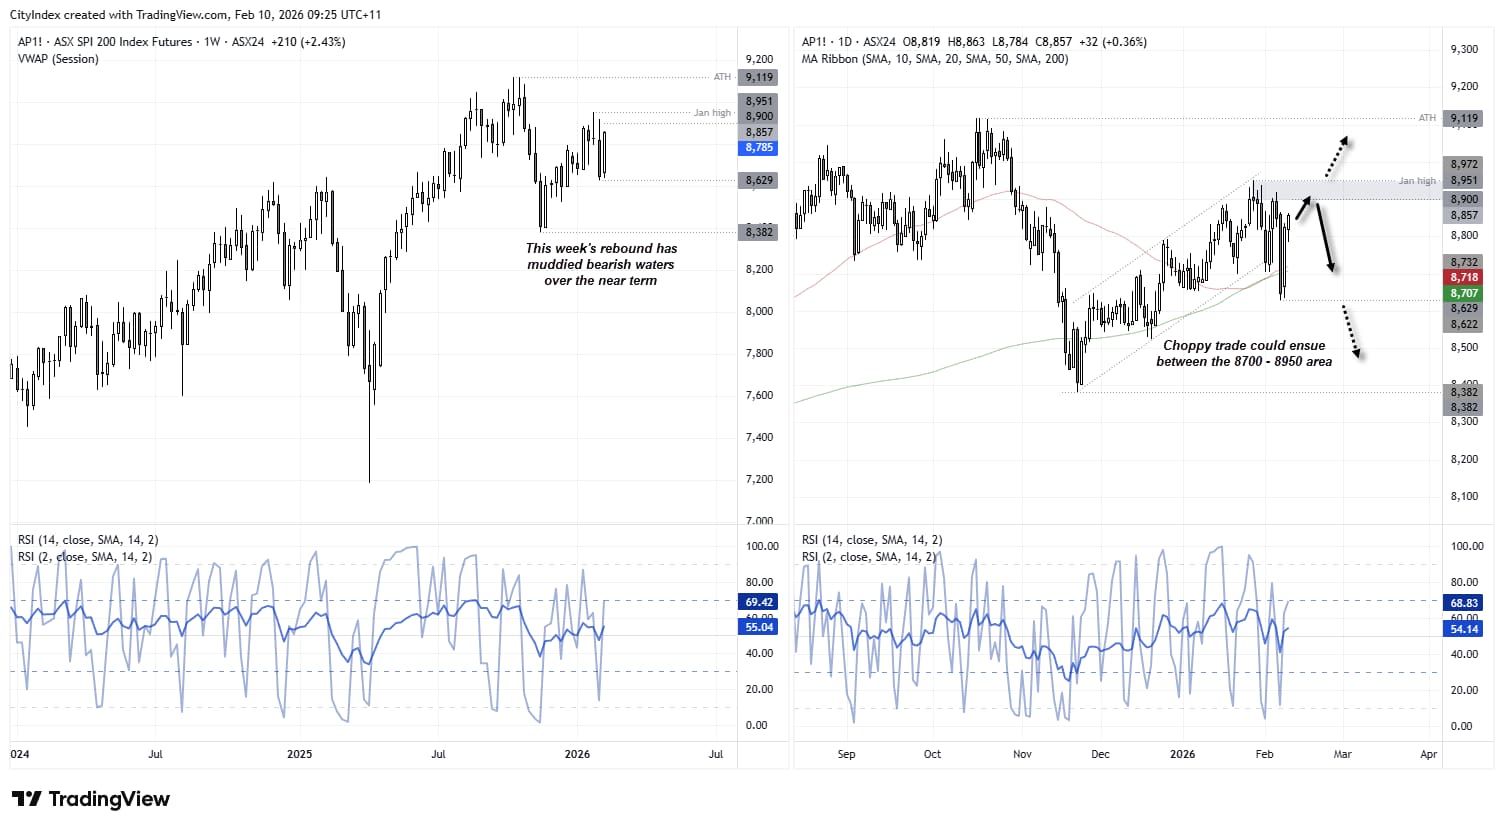
This week’s rebound has muddied the bearish waters. I felt vindicated on Friday when ASX 200 prices turned sharply lower, reinforcing the view that the 8,951 January high marked a corrective peak and that the pullback from record highs was resuming.
However, with momentum now turning higher, bulls may attempt to push SPI 200 futures back towards 8,900 in the near term. A clean break above 8,951 would be more significant, potentially triggering a breakout as short positions are forced to liquidate.
For now, my bias is for another push higher, but for momentum to fade into the 8,900 region, allowing bears another opportunity to reassert control. The 50- and 200-day moving averages, clustered just above 8,700, remain a plausible downside target. That said, a break below Monday’s low would likely be required before assuming a more durable bearish move has re-emerged.
Source: ASX, TradingView
View the full economic calendar
-- Written by Matt Simpson
Follow Matt on Twitter @cLeverEdge
How to trade with City Index
You can trade with City Index by following these four easy steps:
- Open an account, or log in if you’re already a customer
• Open an account in the UK
• Open an account in Australia
• Open an account in Singapore
- Search for the market you want to trade in our award-winning platform
- Choose your position and size, and your stop and limit levels
- Place the trade


