
The ASX 200 recorded a second consecutive record close, placing the index on track for a third straight weekly gain. However, the rally is now pressing into a significant options barrier at 9,200 just as Commonwealth Bank shows signs of stalling and Woolworths tests multi-month highs. With Wall Street futures softer overnight, the local market may struggle to extend gains without fresh catalysts.
View related analysis:
- Nasdaq 100, S&P 500 Outlook: Nvidia Strength Runs Into Resistance
- ASX 200 Market Outlook: Record High Faces Key Options Pivot
- US Dollar Outlook: DXY Hints at a Swing High, but COT Signals Diverge
- Bitcoin Outlook: Is 60k the Bounce Zone or a Trap Door to 50k?
ASX 200 Market Snapshot
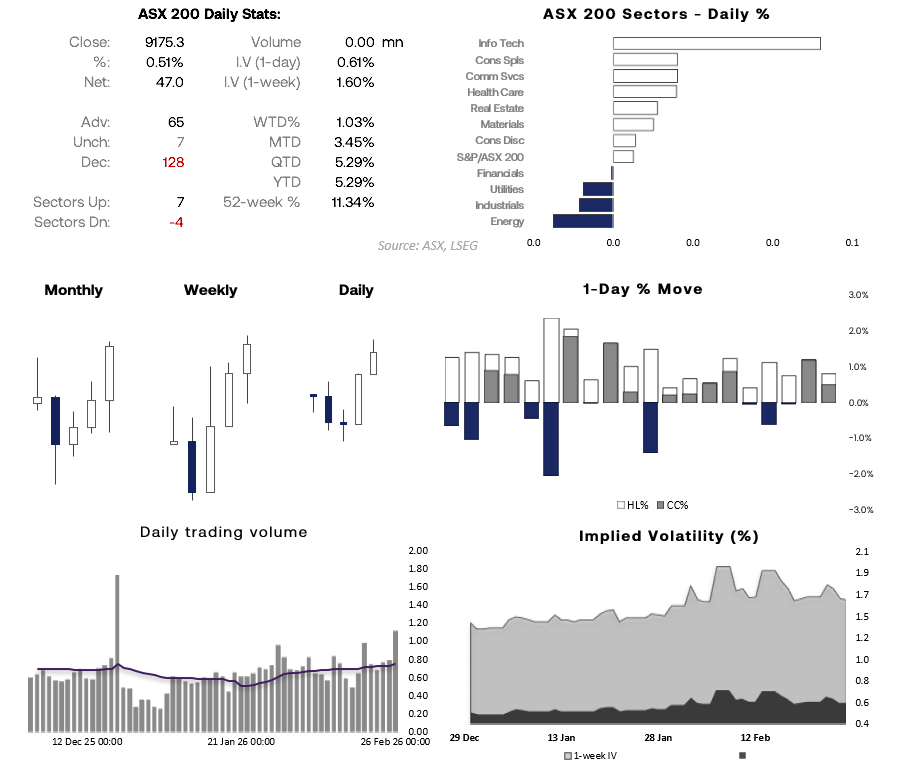
- The ASX 200 closed at a record high for a second consecutive session, leaving the local share market on track for a third straight week of gains.
- Seven of the 11 sectors advanced, led by information technology (XIJ) and consumer staples (XSJ), while energy (XEJ) and industrials (XNJ) were among the laggards.
- It was the highest volume day of the year, although 1-day implied volatility eased from the prior session. That suggests expectations for follow-through may have been tempered despite the fresh highs.
- With the daily high respecting a large options barrier at 9,200 and Wall Street indices softer overnight, the ASX may face headwinds near current levels and could be vulnerable to a pullback ahead of the weekend.
Source: ASX, LSEG

CBA and WOW in Focus
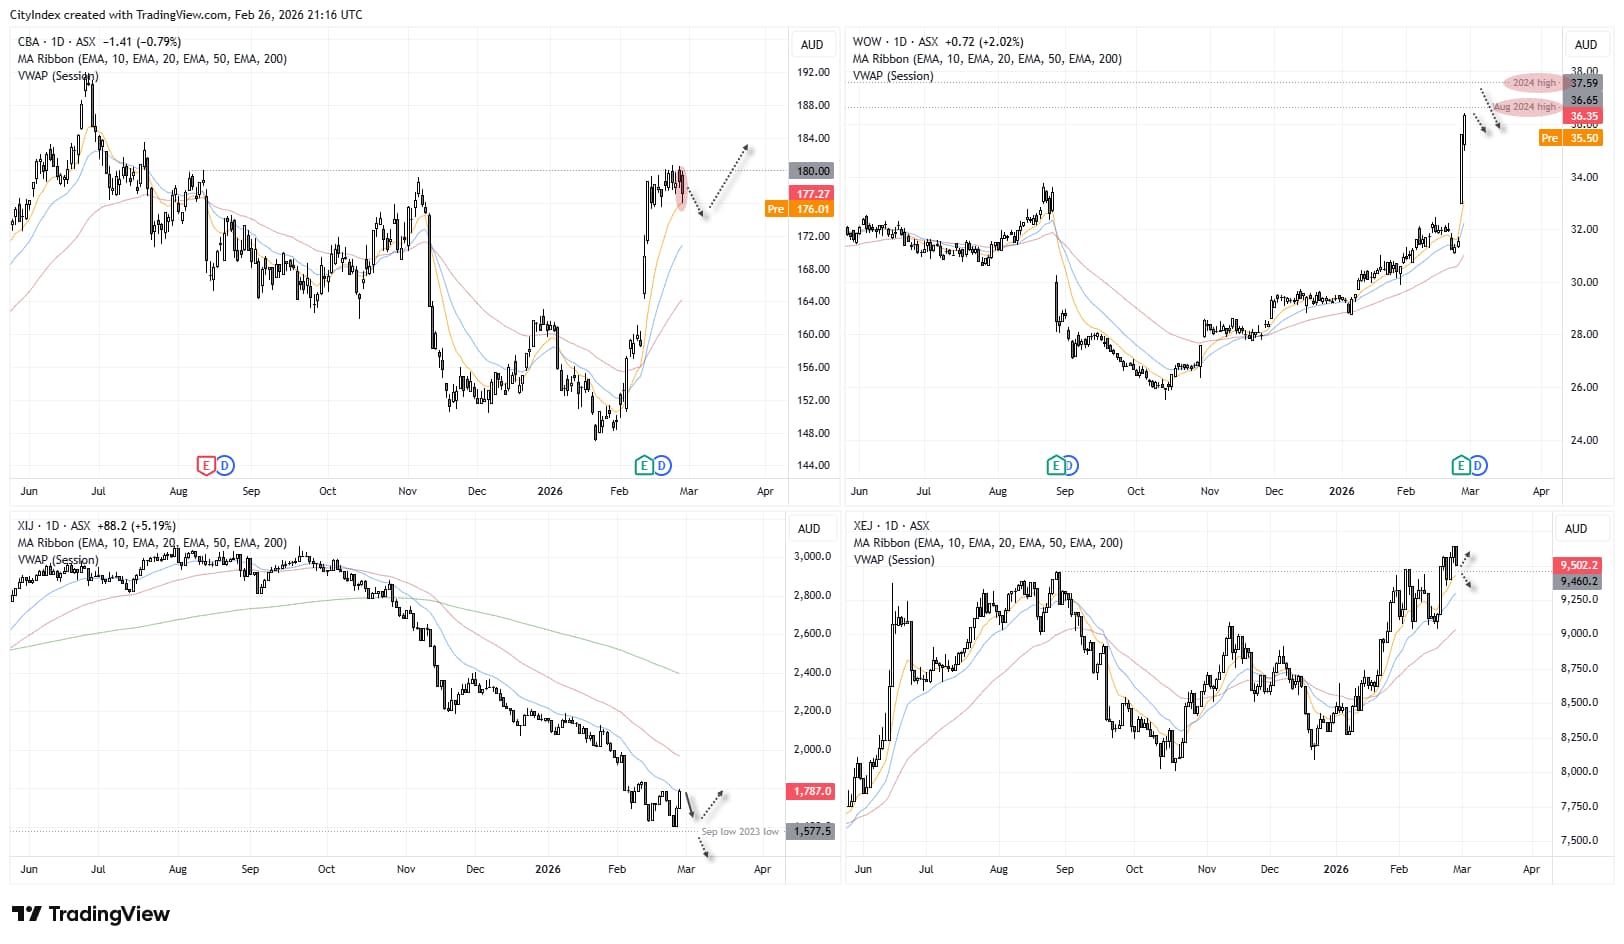
- Commonwealth Bank (CBA) shares have rallied nearly 10% since the close ahead of their strong earnings report, but price is now stalling around the 180 region. Momentum has rolled over after a tight consolidation, and with the ASX’s largest stock pulling back, it could act as a headwind for the broader index.
- Woolworths Group (WOW) has almost single-handedly lifted the consumer staples sector over the past two sessions following its bumper earnings report. However, price is approaching key resistance near the August 2024 and 2024 highs, and momentum is already fading. Chasing strength at these levels carries risk.
- The ASX Technology Sector (XIJ) has rebounded for a second day from a 2.5-year low, but with the Nasdaq reversing at resistance overnight, the backdrop is fragile. The September 2023 low remains a pivotal technical level for the index.
- The ASX Energy Sector (XEJ) printed a bearish engulfing candle on Wednesday as it tracked crude oil lower. While oil recovered after the ASX close, the sector may still face a choppy session given the recent volatility.
Source: ASX, TradingView
ASX 200 Technical Analysis
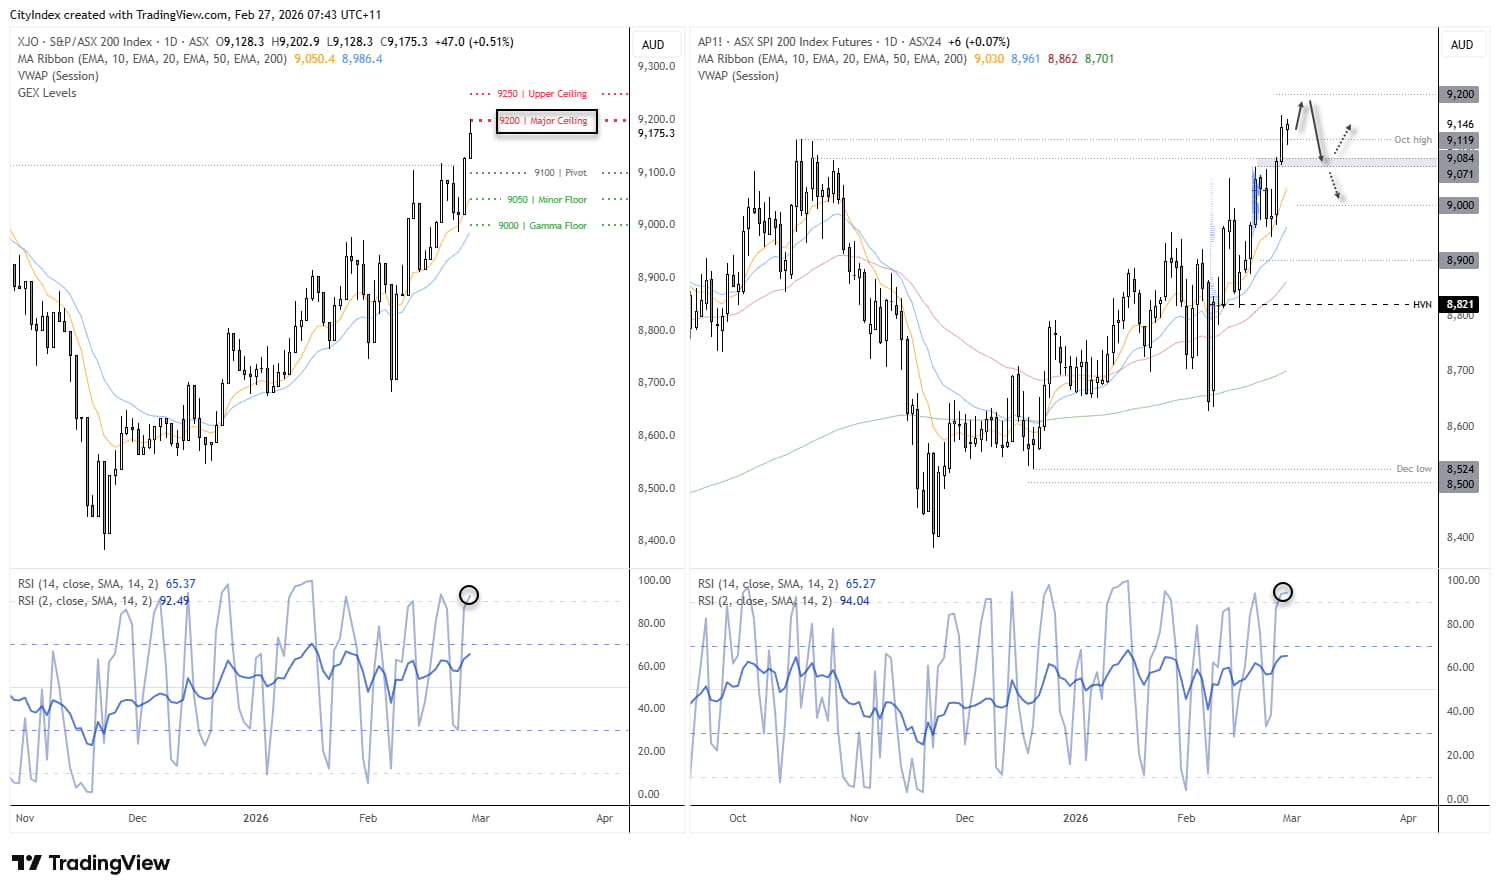
ASX 200 Options Positioning: 9,200 Emerges as Key Resistance Level
The ASX 200 is pressing into a clear call wall at 9,200, where options positioning is heavily skewed to the upside. A clean and sustained break above 9,200 could trigger a squeeze toward 9,250. However, failure to hold above that level would likely see price rotate back toward 9,100, with 9,000 acting as the first meaningful downside floor.

SPI 200 (ASX 200 Futures) Test Key Resistance as Uptrend Presses October Highs
It has been a strong week for bulls, but with the cash market stalling at a key options barrier and Wall Street futures softer overnight, follow-through may prove difficult. Even if buyers manage an early push higher, the 9,200 region is shaping up as firm resistance.
Price is also extended beyond the 10-day EMA, while RSI (2) has been overbought for a second session. That does not invalidate the uptrend — but it does suggest caution when chasing strength near these highs.
Source: ASX, TradingView
View the full economic calendar
-- Written by Matt Simpson
Follow Matt on Twitter @cLeverEdge
How to trade with City Index
You can trade with City Index by following these four easy steps:
- Open an account, or log in if you’re already a customer
• Open an account in the UK
• Open an account in Australia
• Open an account in Singapore
- Search for the market you want to trade in our award-winning platform
- Choose your position and size, and your stop and limit levels
- Place the trade