


The ASX 200 fell for a fourth consecutive session on Monday, logging its weakest daily performance in 47 sessions as traders turned cautious ahead of the Reserve Bank of Australia meeting. With all four major banks pencilling in a 25bp hike — and the risk of a hawkish hold still on the table — sentiment deteriorated across the market. Breadth, sector performance, seasonality and technical signals all suggest the recent rebound may be losing momentum.
View related analysis:
- FX Futures Positioning: USD Index, AUD/USD, USD/CAD | COT report
- Australian Dollar Outlook: AUD/USD Mulls Pullback Despite RBA Hike Bets
- ASX 200 Holds Gains as Jobs Data Fails to Derail Risk Rally
- ASX 200 Market Outlook: CBA Eyes 150 Break, RIO Signals Reversal Risk
ASX 200 Under Pressure as RBA Risk and Bearish Signals Align
ASX 200 Market Snapshot
- The ASX 200 fell for a fourth day on Monday, amid its worst day in 47 as traders turned cautious ahead of the RBA meeting
- The big 4 banks have a 25bp hike pencilled in – though a hawkish hold is also a possibility in my books
- The move has breadth, 136 stocks declined, 56 advanced, 8 were unchanged
- Materials (XMJ) and Energy (XEJ) led the 8 sectors lower, tracking iron ore, gold and silver prices lower
- Communication Services (XTJ) led the 3 ASX sectors higher
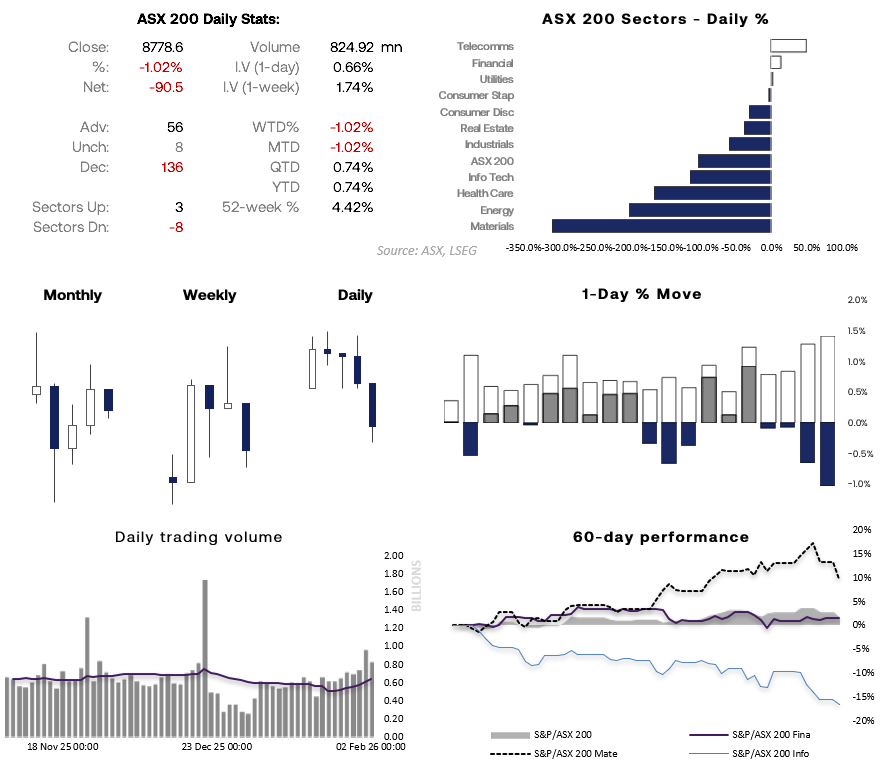
Chart analysis by Matt Simpson - source: ASX, LSEG

ASX 200 Seasonality
- February has delivered an average return of 0.4% over the past 25 years, with a median gain of 0.9%.
- The win rate sits at 59.4%, just shy of two-thirds.
- These are relatively low returns with an OK win rate, but not strong enough to back if larger themes are driving prices lower.
- A probable threat to ASX 200 bulls is a hawkish RBA, and given the bearish clues in price action, the corrective rally may have run its course.
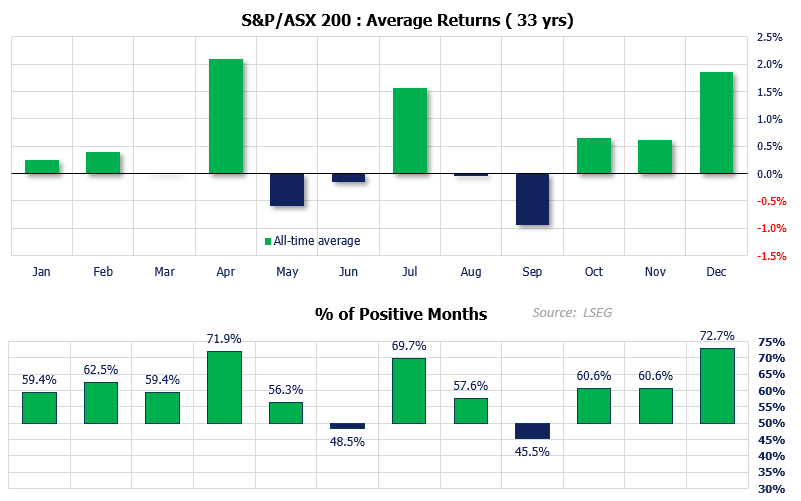
Chart analysis by Matt Simpson - source: ASX, LSEG
ASX 200 Technical Analysis
The left chart shows the ASX 200 cash market. A bearish pin bar formed last week, and momentum has clearly turned lower, confirming a bearish reversal. This may prove to be a lower high relative to the record peak and the start of a fresh leg lower.
Options clusters are shown either side of current prices. The 8800 level could act as a near-term magnet, while any rally towards 8900 — if reached — is likely to be sold into.
The right-hand chart shows SPI 200 (ASX 200 futures). Prices rose after the cash market close after finding support around the 8700 high-volume node (HVN). I suspect this move is false, with sellers likely to fade rallies in anticipation of a break below 8700.
So while near-term momentum points higher, my bias remains bearish while prices remain below last week’s high, targeting a move towards 8500.
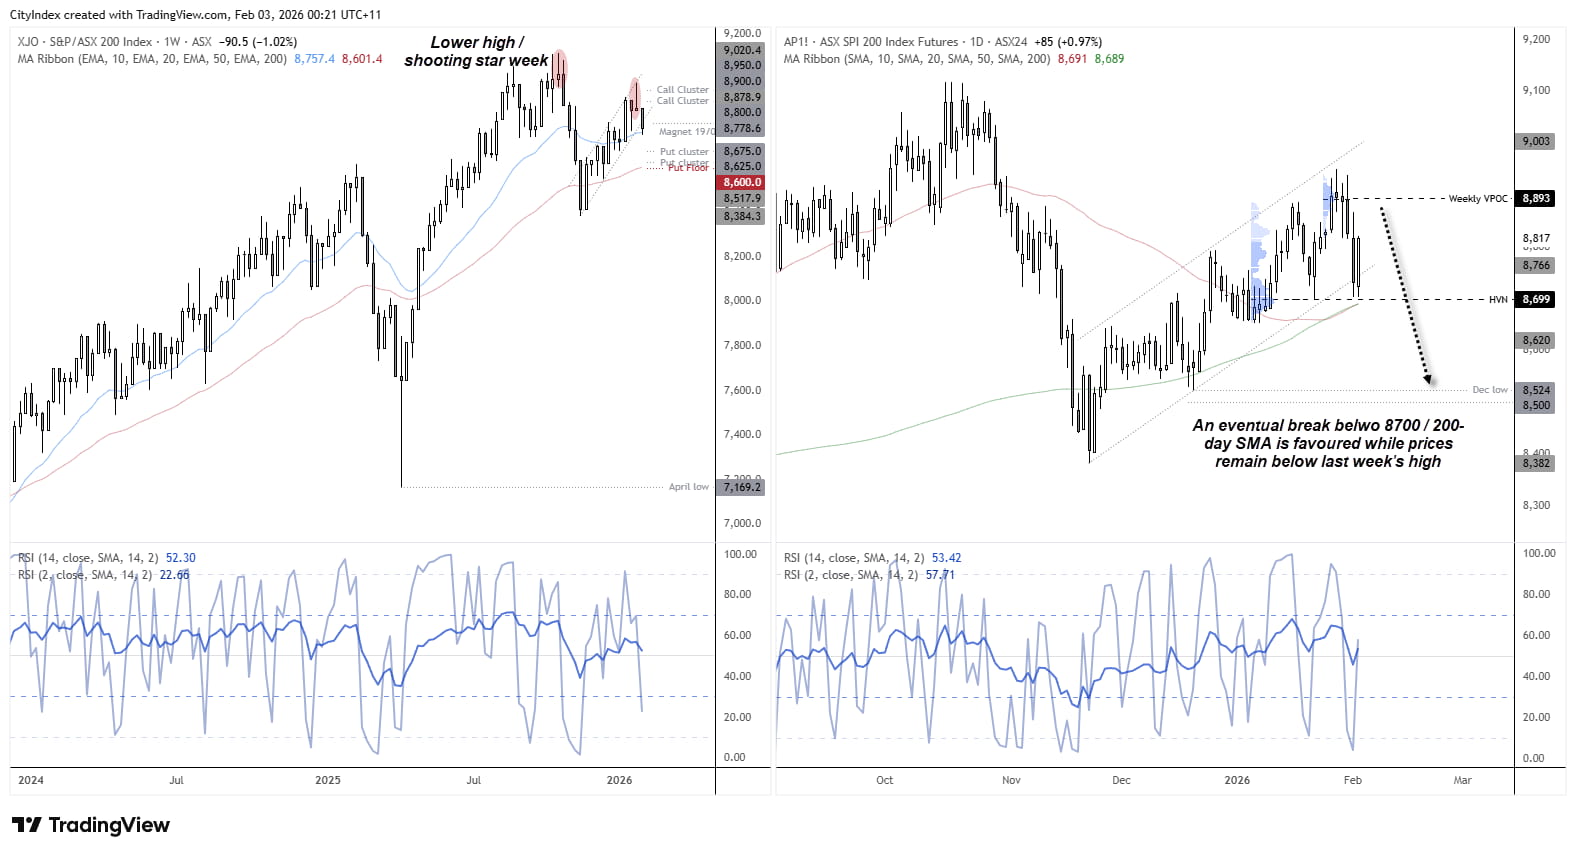
![]() Source: ASX, TradingView
Source: ASX, TradingView
View the full economic calendar
-- Written by Matt Simpson
Follow Matt on Twitter @cLeverEdge
How to trade with City Index
You can trade with City Index by following these four easy steps:
- Open an account, or log in if you’re already a customer
• Open an account in the UK
• Open an account in Australia
• Open an account in Singapore
- Search for the market you want to trade in our award-winning platform
- Choose your position and size, and your stop and limit levels
- Place the trade


