


The risk-off tone that’s been building in recent sessions picked up again in Asia today. Japan’s bond yields jumped on fears the new Prime Minister is preparing a far larger fiscal package than markets had expected, implying heavy JGB issuance. The Nikkei 225 slid more than 3% on Tuesday, pulling broader APAC indices lower and weighing on the ASX 200.
US futures are lower ahead of the European open with the Nasdaq 100 (-0.7%) again leading the selloff, the S&P 500 is down -0.5% and the Dow Jones is off by -0.4%. The ASX 200 cash index fell -1.9% by Tuesday’s close.
View related analysis:
- Nvidia (NVDA) Earnings Stats for Nasdaq 100 Traders
- Nasdaq 100 Lags Dow Jones: Divergent Signals Among Nvidia, Apple, Meta
- Australian Dollar Buckles Under US Dollar Strength, Wall Street Selloff
- ASX 200 Market Outlook: Tech Rout Deepens, Financials Slide, ANZ Reverses
ASX 200 Market Wrap: Tech, Financials Lead Selloff as Risk-Off Accelerates
ASX 200 Suffers Broad-Based Selloff as Volatility Spikes
- The ASX 200 slumped to a five-month low in its worst session in seven months, driven by a sharp risk-off move following a surge in Japanese bond yields. The index posted a 2.2% high-to-low range — its most volatile day since April — while implied volatility jumped to a seven-month high near 14% annualised.
- All 11 sectors finished in the red, led by Technology (XIJ), Materials (XMJ), Financials (XFJ) and Real Estate (XRE). Importantly, Materials and Financials — which together make up more than half of the ASX 200 — are now falling in tandem, signalling a bearish move with real weight behind it.
- BHP dropped -3.7% to a four-week low and is only a few sessions away from retesting its 200-day SMA. Rio Tinto (RIO) lost -2.7%.
- All major banks declined, with Westpac (WBC -3%), NAB (-2.1%), CBA (-1.7%) and ANZ (-0.9%) closing lower.
- Market breadth was extremely weak: 19 stocks advanced, 171 declined and 10 finished unchanged.

Chart analysis by Matt Simpson - source: ASX, LSEG

ASX 200 Cyclical / Defensive Ratio Signals Risk-Off
The Consumer Discretionary (XDJ) to Consumer Staples (XSJ) ratio is sliding sharply, mirroring the ASX 200’s move lower and reinforcing the risk-off tone. This isn’t behaving like a routine pullback within an uptrend — the ratio is breaking down, and bearish momentum across the ASX 200 is accelerating. With the index topping just above 9000, the price action now aligns with a bearish impulsive move rather than a shallow correction.
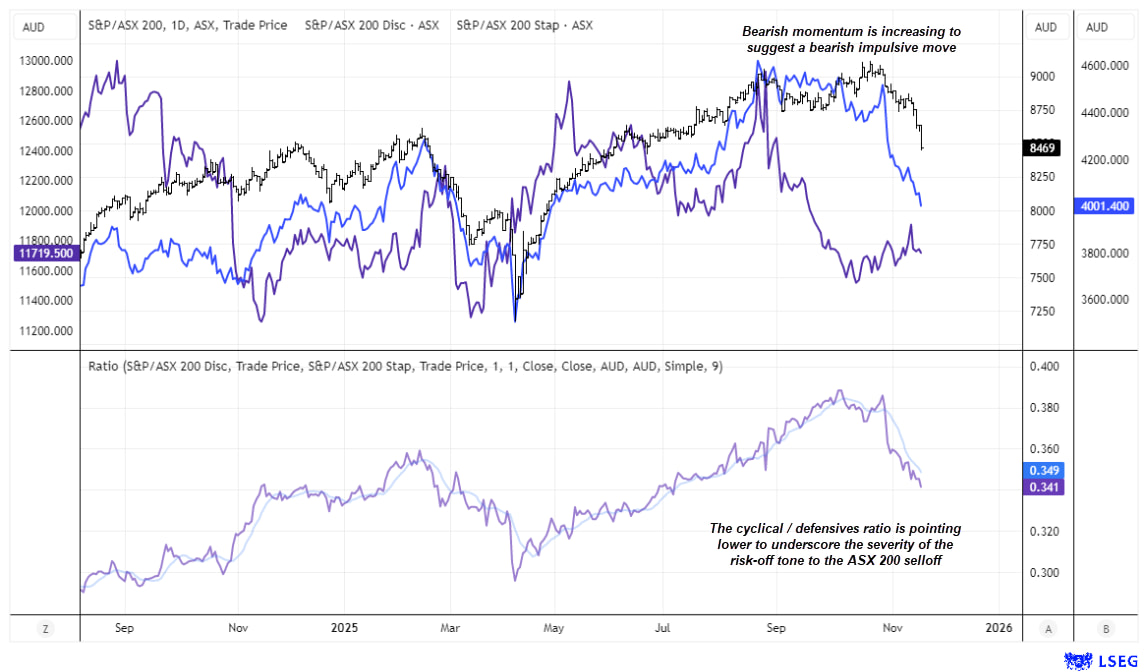
Chart analysis by Matt Simpson - source: ASX, LSEG
ASX 200 Technical Analysis
The sharp acceleration lower on the ASX 200 points to something far more significant than a routine pullback. The warning signs were already there: a bearish pinbar on the monthly chart at the all-time high, several dojis on the weekly, and weeks of deteriorating sector performance. Price action across Technology (XIJ), Financials (XFJ) and now Materials (XMJ) has been signalling a shift long before this latest leg down — something I’ve highlighted consistently in recent updates.
Bearish momentum in technology continues to build, financials are attempting to close the gap, and materials have now turned sharply lower. That last point matters: traders are looking past firmer inflation expectations and stronger commodity prices and are instead rotating to cash as risk-off sentiment takes hold.
ASX 200 futures have broken below both the 200-day EMA and 200-day SMA. A move toward the 8400 area — aligning with a long-term 38.2% Fibonacci retracement — now looks likely. Given the velocity of this decline, a break below 8400 appears the higher-probability outcome, which brings 8200 (50% retracement) and even 8000 (61.8%) into view for bears.
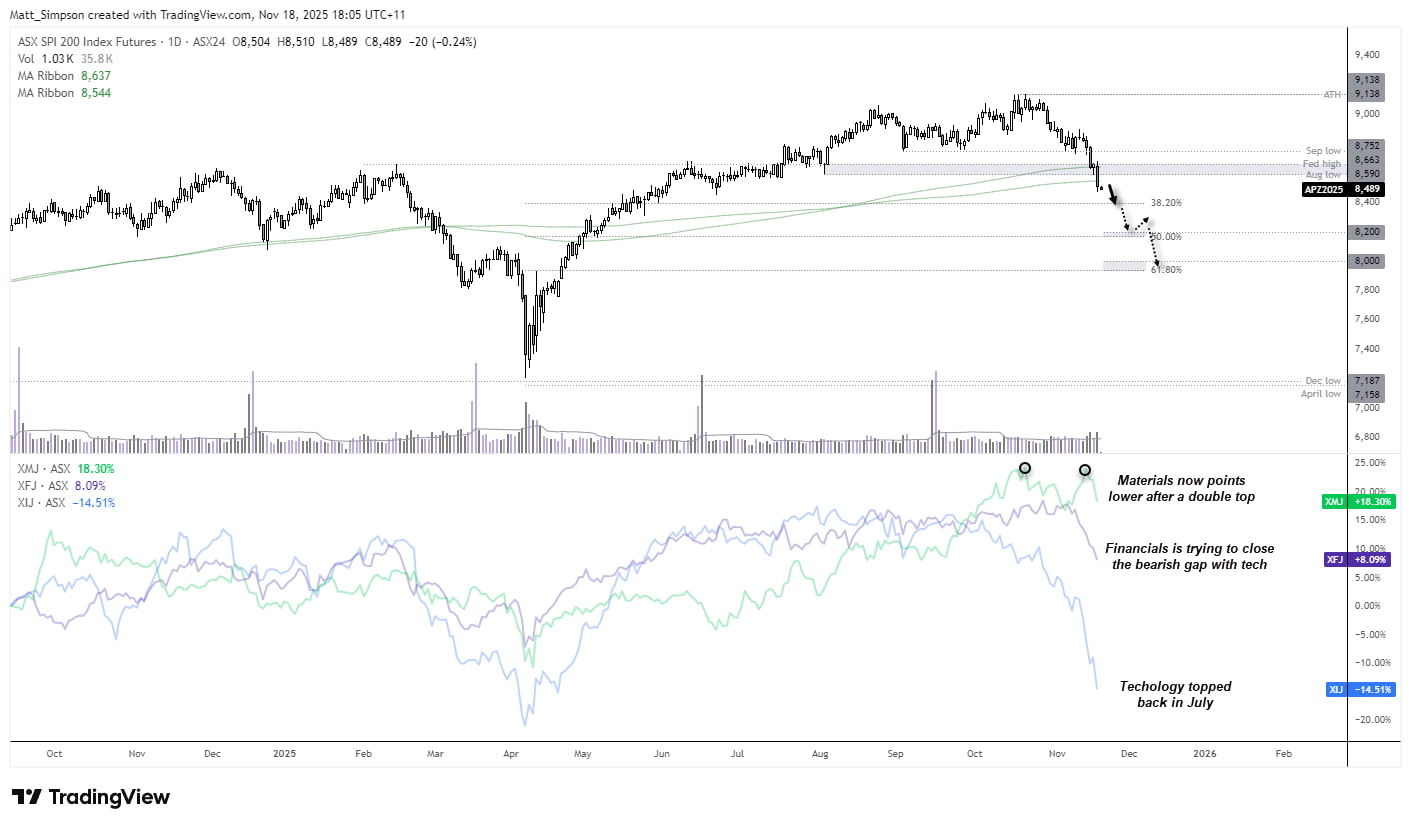
Chart analysis by Matt Simpson - Source: TradingView, ASX SPI 200 Index Futures

View the full economic calendar
-- Written by Matt Simpson
Follow Matt on Twitter @cLeverEdge
How to trade with City Index
You can trade with City Index by following these four easy steps:
- Open an account, or log in if you’re already a customer
• Open an account in the UK
• Open an account in Australia
• Open an account in Singapore
- Search for the market you want to trade in our award-winning platform
- Choose your position and size, and your stop and limit levels
- Place the trade


