


The ASX 200 traded flat on Thursday, marking its smallest daily range in over a week despite positive breadth across the market. Yet the lack of follow-through at record highs, coupled with reversal signals on the daily and weekly charts, hints that momentum may be fading. Energy’s rebound helped support the index, but heavyweight sectors like Financials and Materials are showing early signs of fatigue — leaving the broader ASX looking vulnerable if the rotation fails to broaden out.
View related analysis:
- ASX 200 Morning Market Outlook: Woolworths (WOW) Set To Bounce?
- ASX 200 Morning Market Outlook: ASX Hits Record High, Materials Lead
- ASX 200 Morning Market Outlook: Financials Lead Gains as CBA Rebounds
- ASX 200 Morning Market Outlook: Bad News Is Good News for ASX
Sector Rotation Fails to Lift Broader ASX Momentum
ASX 200 Market Snapshot
- It was effectively a non-event for the ASX 200 on Thursday, with the index closing flat and recording its smallest daily range in nine sessions.
- Despite the quiet session, breadth was positive with 135 stocks advancing (67.5%) compared to 53 decliners (26.5%).
- The index looks on track to form a small shooting star candle for the week within the upper wick of the prior week’s spinning top, which may suggest the market is topping out.
- A two-bar reversal pattern (dark cloud cover) also formed on Tuesday and Wednesday near the record high, hinting at potential exhaustion among bulls.
- Fridays have averaged the lowest daily ranges of the week at 63 points over the past three months, compared to 73.7 points over the past year.
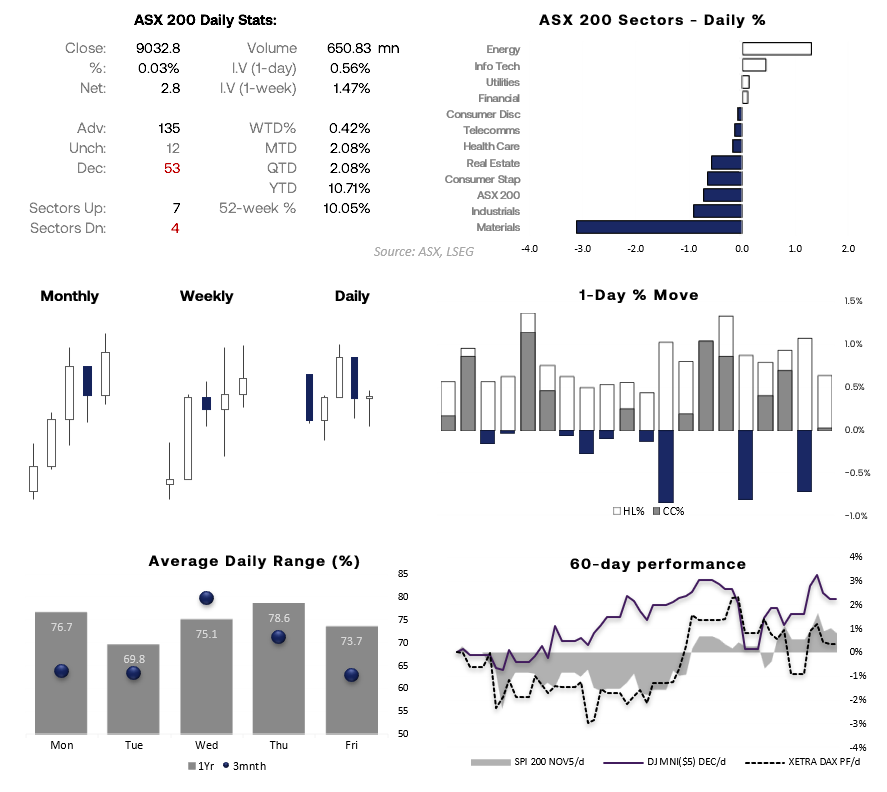
Chart analysis by Matt Simpson - source: ASX, LSEG

ASX 200 Sector Analysis
The Energy sector (XEJ) surged 3.2% on Thursday — its best day in four months — as higher oil prices helped confirm that the double bottom around the 8,000 level likely marked the end of its correction. The sector had underperformed the broader ASX 200 since August, but recent rotation now suggests a turnaround in relative strength.
Meanwhile, Financials (XFJ) and Materials (XMJ) — previously the main powerhouses driving the index — have started to lose momentum. Should these heavyweight sectors continue to falter, it would increase the risk of a deeper pullback for the ASX 200.
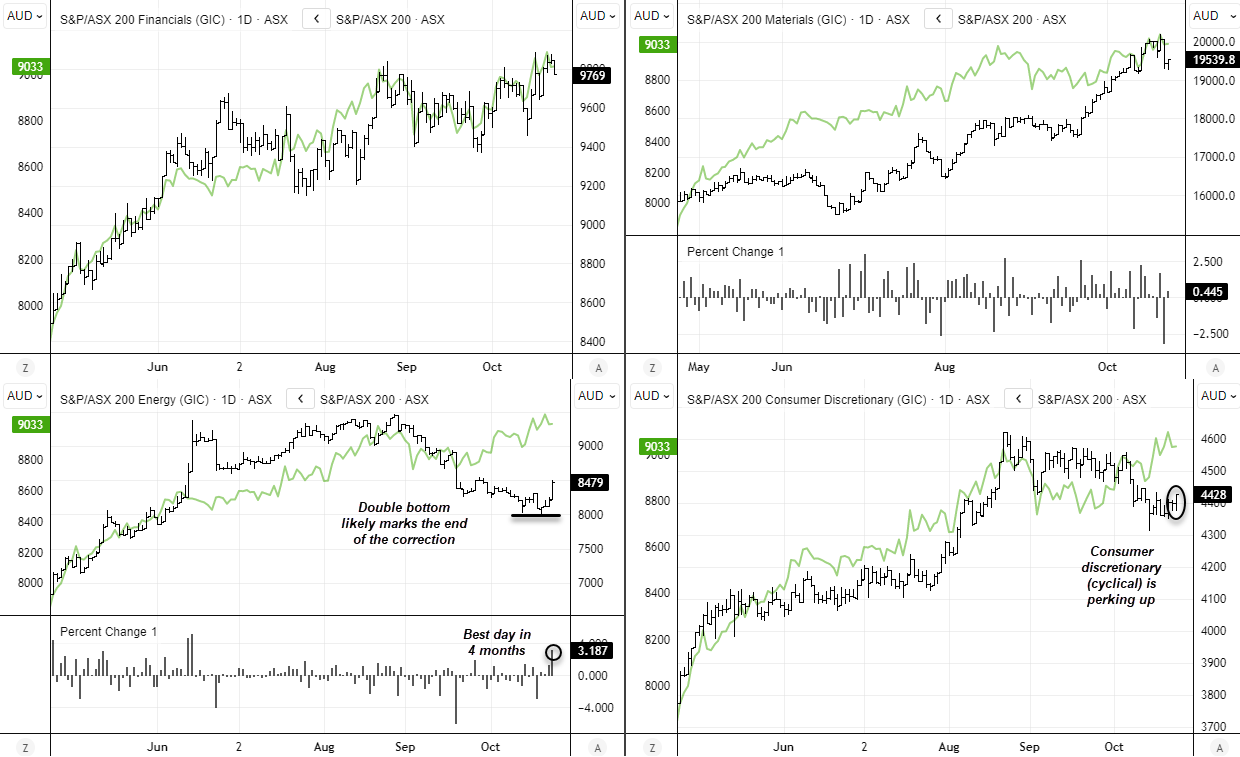
Chart analysis by Matt Simpson - source: ASX, LSEG
ASX 200 technical Analysis
The weekly chart shows a wide-legged doji formed last week and the ASX has mostly traded around its upper wick. The intraday chart displays a plethora of resistance levels overhead with a rising wedge. Bears could seek to fade into moves towards resistance levels on the assumption of a return back to 9000.
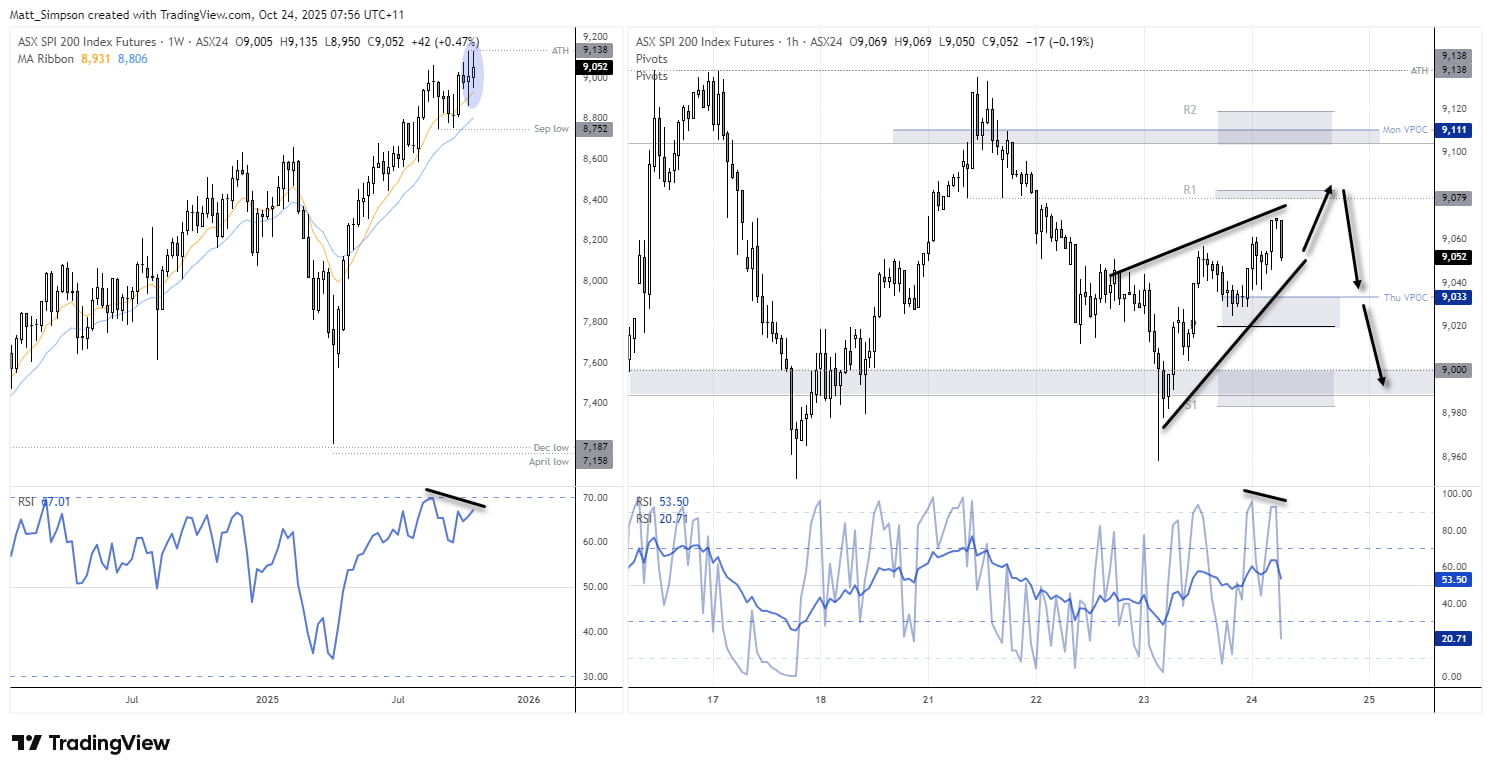
Chart analysis by Matt Simpson - Source: TradingView, ASX SPI 200 Index Futures
View the full economic calendar
-- Written by Matt Simpson
Follow Matt on Twitter @cLeverEdge
How to trade with City Index
You can trade with City Index by following these four easy steps:
- Open an account, or log in if you’re already a customer
• Open an account in the UK
• Open an account in Australia
• Open an account in Singapore
- Search for the market you want to trade in our award-winning platform
- Choose your position and size, and your stop and limit levels
- Place the trade


