
The ASX 200 looks set to snap a five-month winning streak — its longest since August 2021. While that episode led to a 16% correction over the following year, this time the setup is more nuanced. The index has lagged global peers such as the S&P 500 and Dow Jones over the past 60 sessions, and end-of-month flows have produced a shooting star candle to warn of near-term weakness. Yet, strong dip-buying interest suggests bulls remain active, with traders now weighing whether consolidation will resolve in a breakout or deeper retracement.
ASX 200 Market Snapshot: Weakness Emerges After Five-Month Rally
- The ASX 200 is on track to snap a five-month winning streak, its longest since August 2021.
- Back then, the index went on to suffer a 16% correction over the following year — whether history repeats or merely rhymes remains to be seen.
- Over the past 60 trading days, the ASX 200 has clearly underperformed global peers such as the Dow Jones and S&P 500.
- End-of-month flows left the ASX 200 cash index with a shooting star candle, signalling potential near-term weakness.
- Nine of eleven sectors declined on Monday, led by Energy and Telecoms, while Materials and Industrials were the only gainers.

Charts prepared by Matt Simpson - data source: ASX, LSEG
View related analysis:
- ASX 200 Outlook: RBA to Stay Cautious After Softer Employment Report
- Australian Dollar Outlook: AUD/USD Under Pressure Ahead of CPI and PMIs
- AUD/USD, AUD/JPY: Australian Dollar Diverges Against US Dollar and Yen
- ASX 200 and Nikkei 225 Analysis: Technicals and COT Outlook
ASX 200 Technical Analysis
The daily chart shows the ASX 200 trading in a sideways range between ~8750 and 8900 over the past month. Initially, I considered this consolidation to be a choppy wave ‘b’ that required a leg ‘c’ lower. However, the index has held up well, suggesting buyers are willing to step in on dips in anticipation of a bullish breakout. I am now leaning toward the latter scenario.
Monday’s rally into resistance was impressive, and I suspect bulls view the current, albeit shallow, pullback as simply that — a pause within a move that wants to push higher.
On the 4-hour chart, the ASX is holding around a high-volume node (HVN) and trades just above the weekly pivot point (8832). Unless risk appetite turns sharply lower, I am inclined to seek evidence of a swing low, with the expectation of at least a retest of the range highs — and potentially a breakout for pre-emptive bulls.
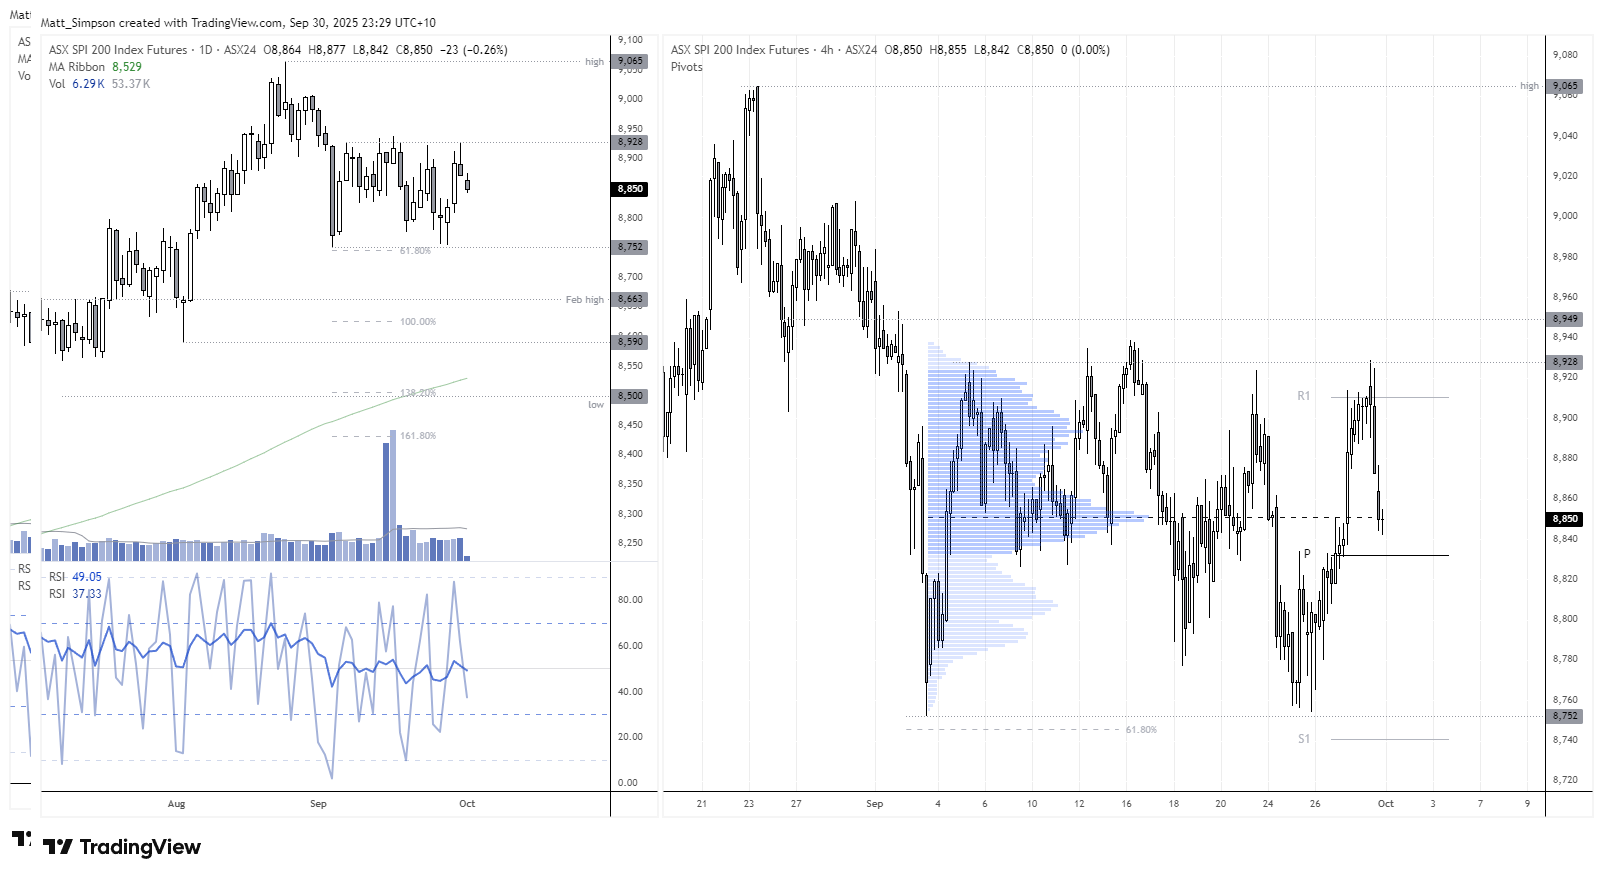
Chart analysis by Matt Simpson - Source: TradingView, ASX SPI 200 Index Futures

Global Index Futures and Asian Market Moves
Asian Indices:
- ASX 200: Fell by -14 points (-0.16%) and currently trades at 8,848.80
- Nikkei 225: Rose by 121.28 points (0.33%) and currently trades at 36,668.23
- Hang Seng: Rose by 232.68 points (0.87%) and currently trades at 26,855.56
- China A50: Fell by -46.7 points (-0.31%) and currently trades at 15,142.31
US index futures:
- Dow Jones Futures: Down -66 points (-0.14%)
- S&P 500 Futures: Down -8.75 points (-0.13%)
- Nasdaq 100 Futures: Down -20.5 points (-0.08%)
View the full economic calendar
-- Written by Matt Simpson
Follow Matt on Twitter @cLeverEdge
How to trade with City Index
You can trade with City Index by following these four easy steps:
- Open an account, or log in if you’re already a customer
• Open an account in the UK
• Open an account in Australia
• Open an account in Singapore
- Search for the market you want to trade in our award-winning platform
- Choose your position and size, and your stop and limit levels
- Place the trade