


The ASX 200 climbed to a record high on Thursday as traders embraced the idea that weaker labour market data could hasten an RBA rate cut. Australia’s unemployment rate rose to a four-year high, fuelling optimism that policy easing may arrive sooner than expected. Nine of the eleven ASX sectors advanced, led by Real Estate and Health Care, while Info Tech lagged amid a burst of volatility.
View related analysis:
- Australian Dollar Falls as Unemployment Hits 4-Year High
- ASX 200 Morning Market Outlook: Fortescue Breakout, Materials Rally
- Bitcoin, S&P 500 Outlook: Wall Street Volatility Rattles BTC
- British Pound Price Action Setups: GBP/USD, GBP/JPY
ASX 200 Climbs to Record High on Rising RBA Rate-Cut Hopes
ASX 200 Cash Market Snapshot
- Band news was good news for ASX 200 traders on Thursday, with unemployment rising to a 4-high spurring bets of an RBA cut and sending the local share market to a fresh record high.
- The ASX 200 rose for a third day during its most volatile day’s trade in two weeks
- 9 of the 11 ASX sectors rose, led by Real Estate (XRE) and healthcare (XHJ), while tech (XTJ) was the laggard
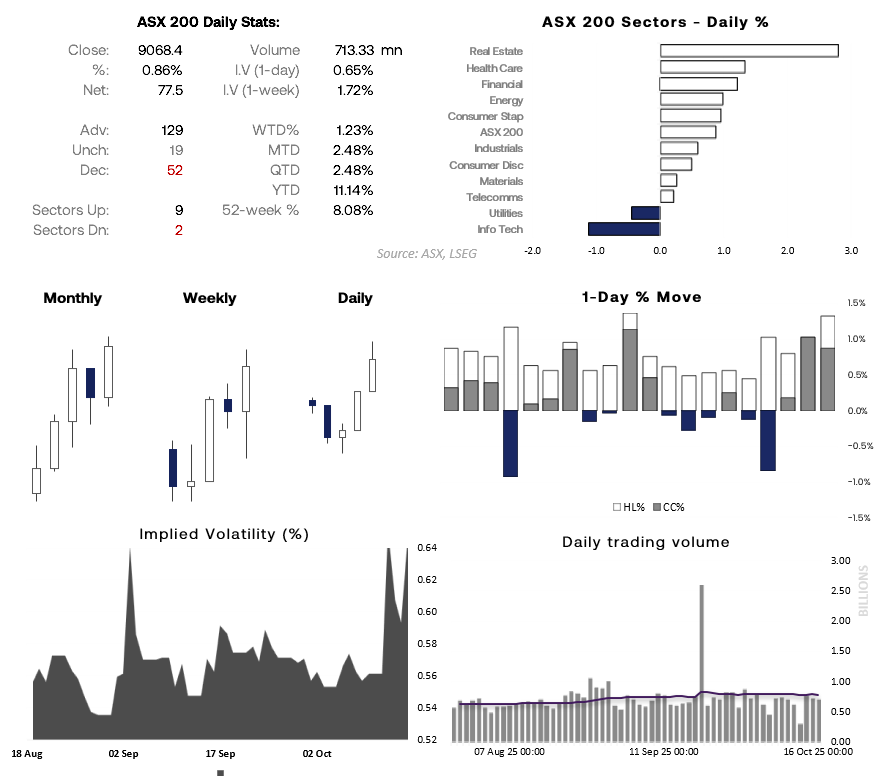
Chart analysis by Matt Simpson - data source: ASX, LSEG

ASX 200 Sector Analysis
The real estate sector (XRE) enjoyed its best day in six months with a 2.7% gain, breaking above a bearish retracement line and suggesting the pullback from its August high has ended. Healthcare (XHJ) shares rose for a second day to reach a seven-week high, further supporting the view that September’s low marked a key turning point.
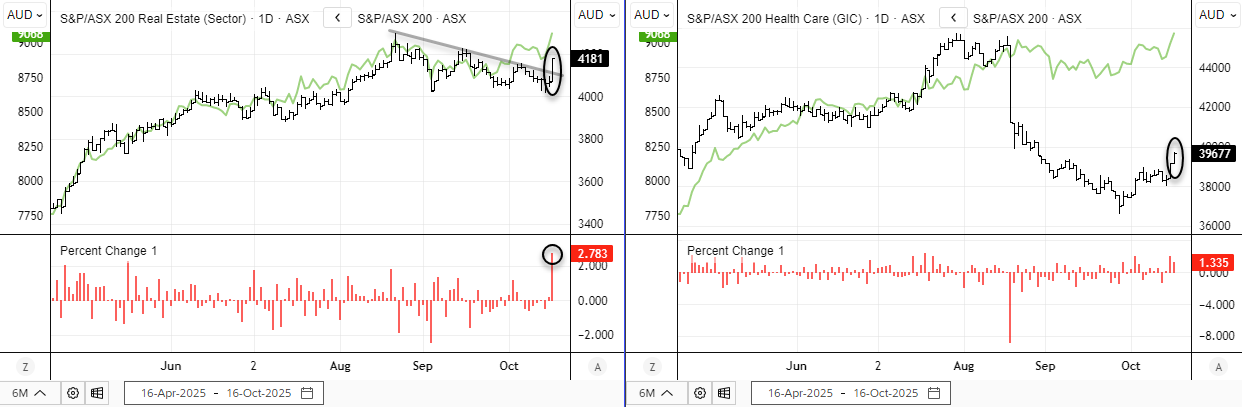
Chart analysis by Matt Simpson - Source: ASX, LSEG
Goodman Group (CMG) Technical Analysis
The weekly chart shows a strong rally from the April low began to retrace in August, though support was found around 32.50. Three swing lows have been seen around that level, the latter two of which are higher lows. Thursday say a clear gap higher above the 200-day EMA followed by bullish range expansion. I strongly suspect we have seen the corrective low and momentum has realigned with the bullish move from the April low rally.
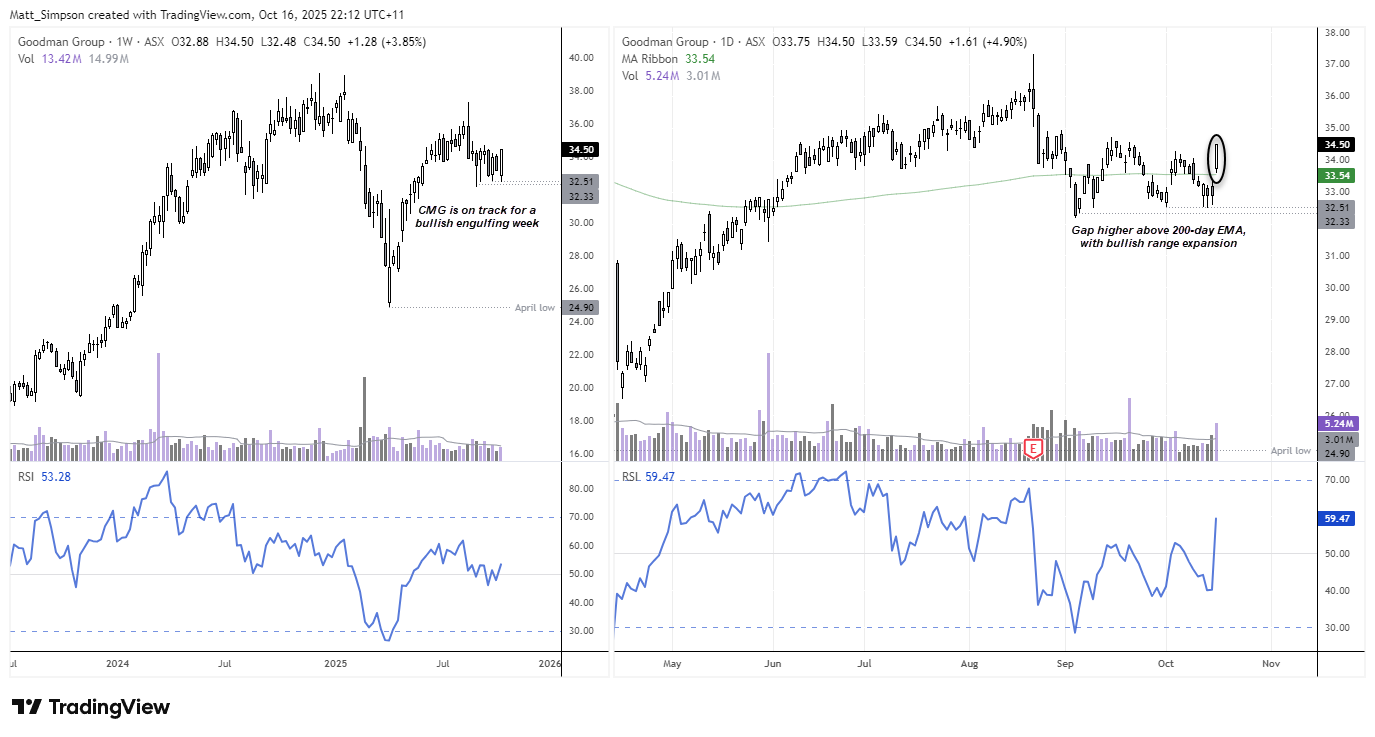
Chart analysis by Matt Simpson - Source: ASX, TradingView, Goodman Group (CMG)

ASX 200 Futures (SPI 200) Technical Analysis
A bullish engulfing day has formed on the ASX 20 futures chart. But with Wall Street turning lower overnight, I suspect gains could be limited today ahead of the weekend. That said, support was found around the August high and weekly R1 pivot point. Perhaps a near-term bonce is due head of a pullback.
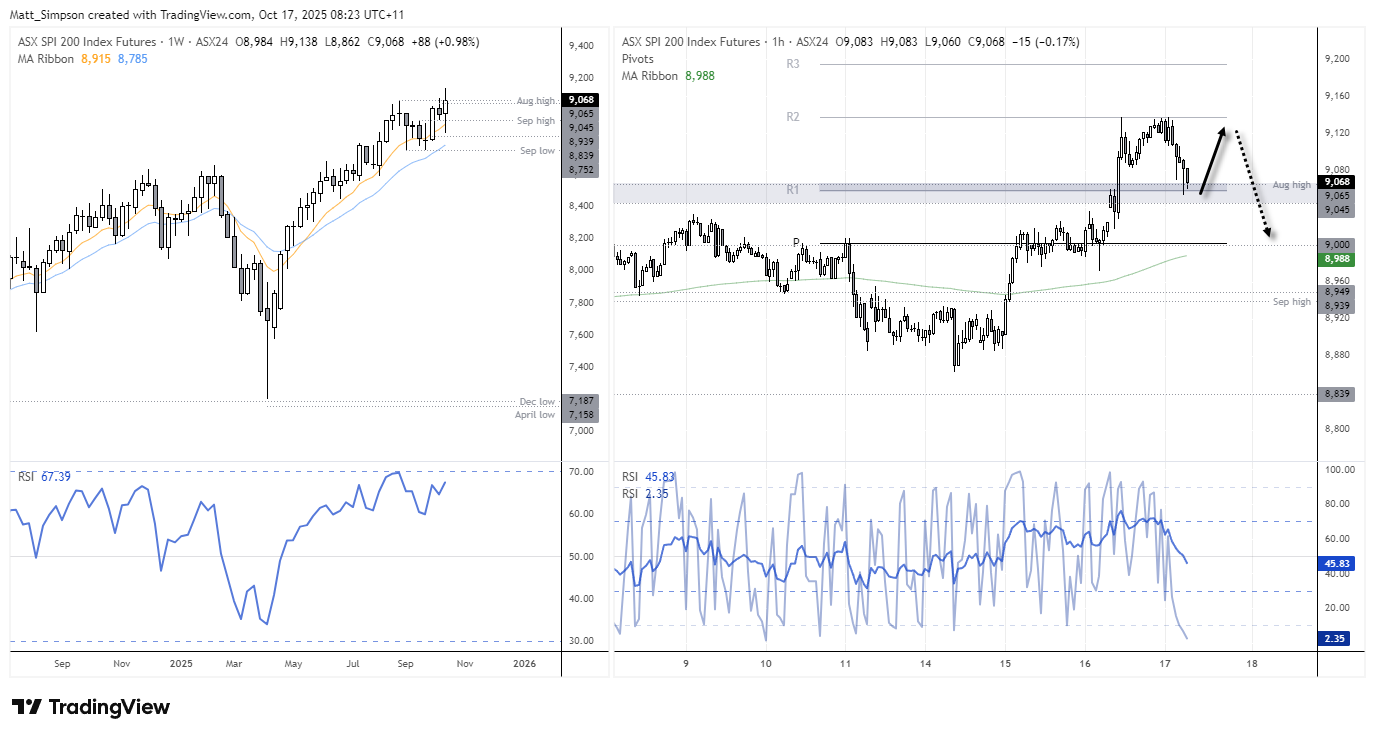
Chart analysis by Matt Simpson - Source: TradingView, ASX SPI 200 Index Futures
View the full economic calendar
-- Written by Matt Simpson
Follow Matt on Twitter @cLeverEdge
How to trade with City Index
You can trade with City Index by following these four easy steps:
- Open an account, or log in if you’re already a customer
• Open an account in the UK
• Open an account in Australia
• Open an account in Singapore
- Search for the market you want to trade in our award-winning platform
- Choose your position and size, and your stop and limit levels
- Place the trade


