


The ASX 200 opened the week cautiously, forming a modest bullish pinbar ahead of the Reserve Bank of Australia’s policy meeting. The RBA is unlikely to cut rates today, given the hot Q3 CPI figures, though that may already be priced into the ASX. Unless the RBA surprises with a hawkish hold, it could still allow ASX bulls a cheeky bounce before the index resumes its next anticipated leg lower.
While volume remained thin and sentiment fragile, the index is showing early signs of stabilisation following recent weakness. With November historically one of the stronger months for the ASX, traders will be watching whether seasonal tailwinds and technical support can offset lingering bearish pressure.
View related analysis:
- ASX 200 Morning Market Outlook: Bearish Reversal Pattern For October
- ASX 200 Morning Market Outlook: Sectors Highlight Structural Weakness
- ASX 200 Morning Market Outlook: Woolworths (WOW) Set To Bounce?
- ASX 200 Morning Market Outlook: Westpac (WBC) Leads Big 4 Lower Post-CPI
ASX 200 Eyes Seasonal Rebound as Traders Await RBA
ASX 200 Market Snapshot
- While we didn’t get the rebound I had pencilled in for the ASX on Monday, the index did print a small bullish pinbar on the daily chart.
- However, the reversal is not especially convincing, given that daily trading volume was around half its usual level — likely reflecting caution ahead of the RBA meeting.
- With only 63 stocks (32%) advancing, 126 (63%) declining, and 10 unchanged (5%), the ASX remains on fragile footing.
- Information Technology (XIJ), Financials (XFJ), and Energy (XEJ) provided modest support, while Health Care (XHJ) and Materials (XMJ) led the declines.
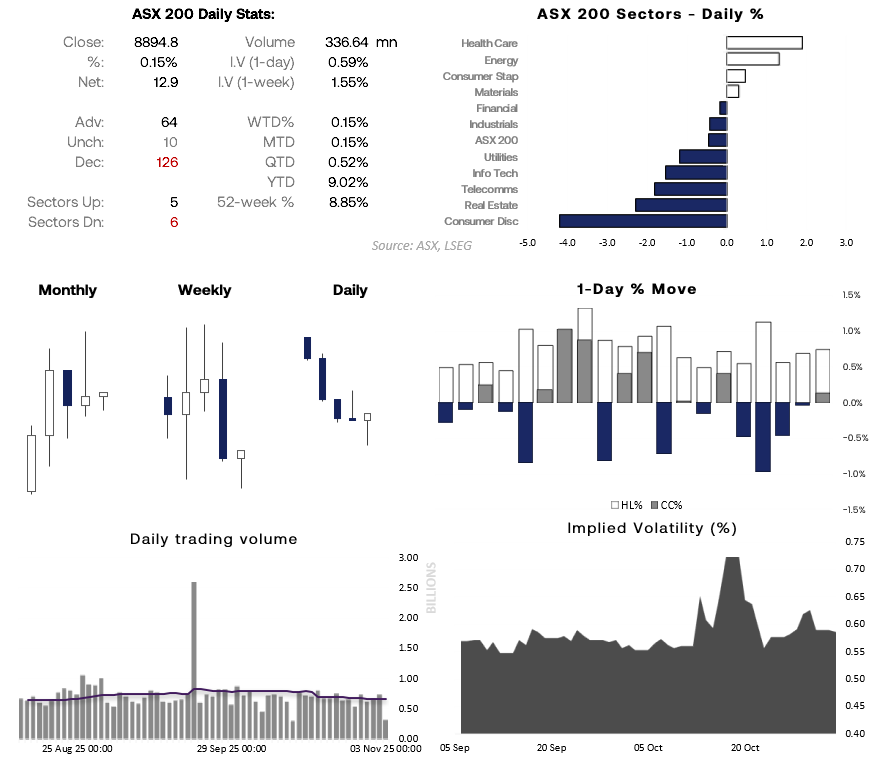
Chart analysis by Matt Simpson - source: ASX, LSEG

ASX 200 Seasonality
Over the past 33 years, the ASX 200 has averaged a positive return of 0.62% and a median return of 1.1% in November. Bulls have also enjoyed a win rate of 60.6%, making it the third most volatile month of the year with a high-to-low range of 6.6%.
It’s interesting to note that the ASX followed its seasonal tendency in October, albeit only just. Its 0.37% return was below its average of 0.65% and well beneath the median return of 2% — not to mention the month closed with a bearish shooting star reversal candle.
It will be worth watching whether the ASX continues to follow its seasonal tendency and deliver a gain this month, especially given the bearish clues highlighted recently, including weaker market internals and bearish index price action.
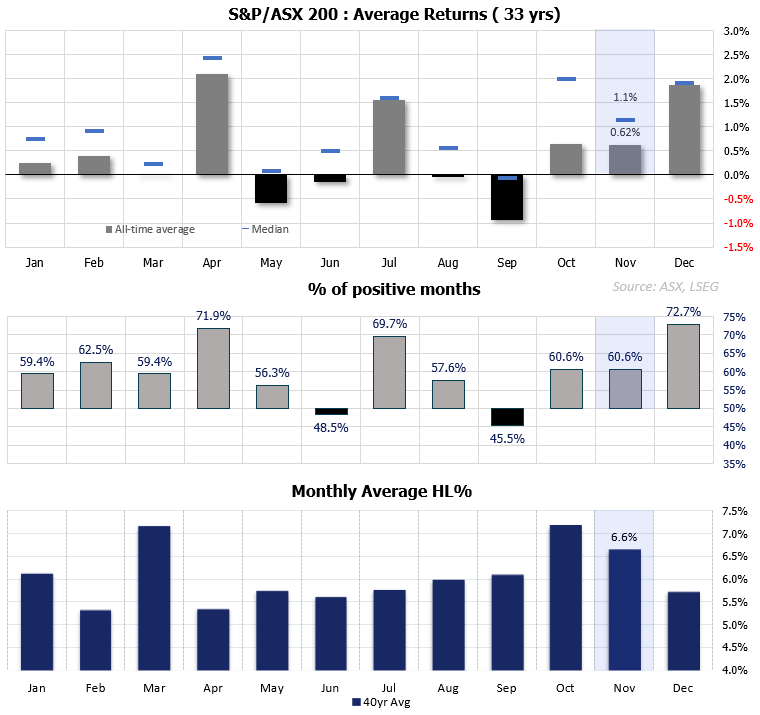
Chart analysis by Matt Simpson - Source: ASX, LSEG
ASX 200 Futures (SPI 200) Technical Analysis
A bullish hammer formed on Monday, with its low marking a false break of the 14 October low and September volume point of control (VPOC). This suggests a swing low may have formed, assuming it has not already arrived. Bulls could look to buy dips within Monday’s range and maintain a near-term bullish bias, targeting 8,950 initially, with 9,000 coming into focus if that level breaks.
However, given the bearish clues from market internals and price action across higher timeframes, I’ll also watch for evidence of a swing high on the ASX 200 daily chart should the expected bounce unfold. A bearish engulfing week shows momentum turning lower after the ASX printed a spinning top doji and shooting star at record highs, accompanied by a multi-week bearish RSI divergence.
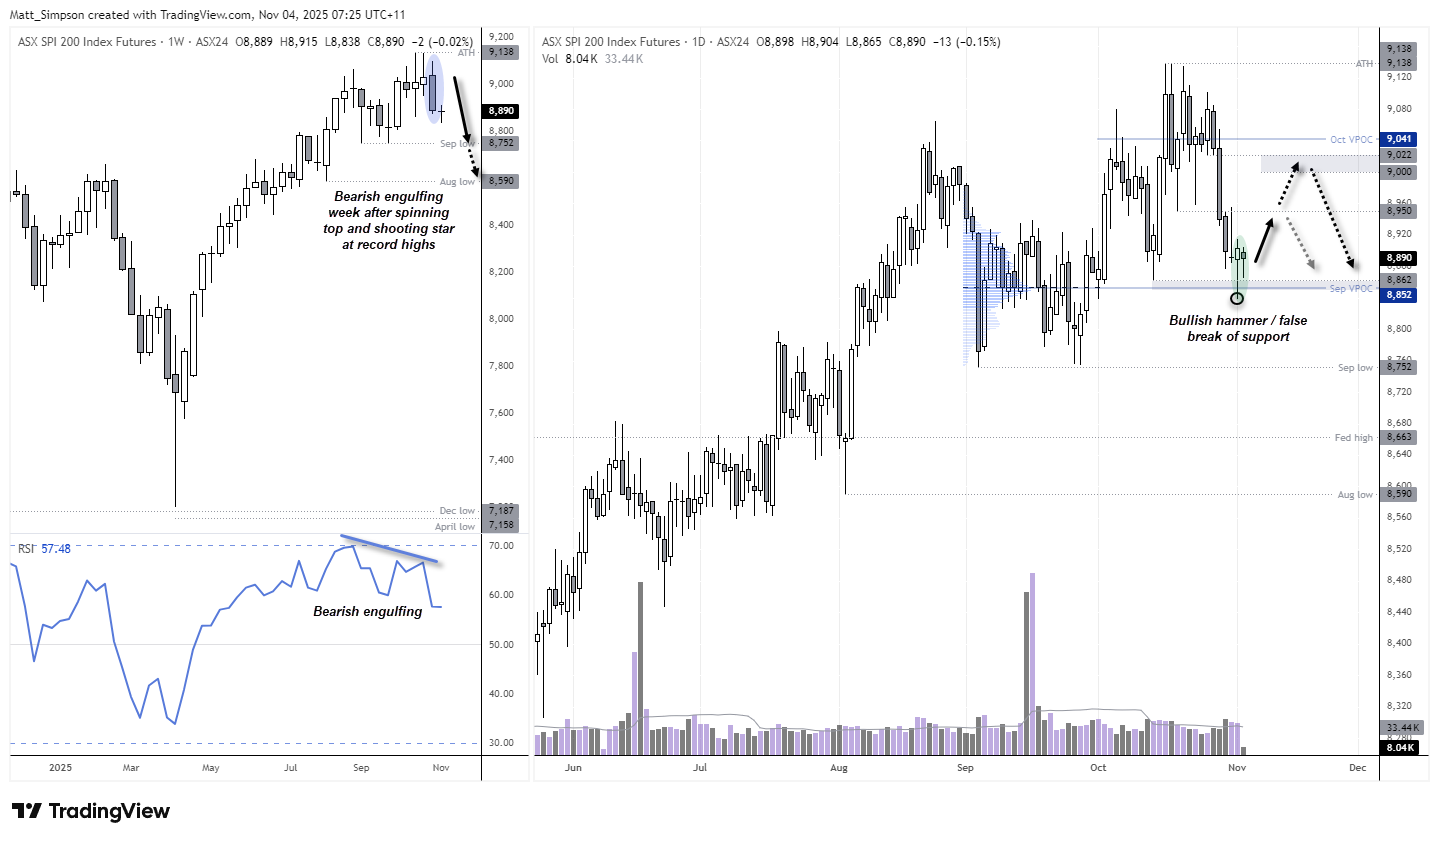
Chart analysis by Matt Simpson - Source: TradingView, ASX SPI 200 Index Futures
View the full economic calendar
-- Written by Matt Simpson
Follow Matt on Twitter @cLeverEdge
How to trade with City Index
You can trade with City Index by following these four easy steps:
- Open an account, or log in if you’re already a customer
• Open an account in the UK
• Open an account in Australia
• Open an account in Singapore
- Search for the market you want to trade in our award-winning platform
- Choose your position and size, and your stop and limit levels
- Place the trade


