
The ASX 200 fell on Tuesday as biotech heavyweight CSL suffered a 15% plunge following a revenue downgrade, marking its worst day since August. The selloff dragged the healthcare and materials sectors lower, offsetting modest gains in financials. With key correlations to Wall Street indices weakening and momentum indicators turning cautious, traders are questioning whether the local market is preparing for a broader retracement.
View related analysis:
- ASX 200 Morning Market Outlook: Bulls Lack Wall Street's Pace
- Nasdaq 100 Continues To Lead Wall Street Higher Ahead of Fed Decision
- ASX 200 Morning Market Outlook: ASX Looking Shaky At The Highs
- Australian Dollar Outlook: AUD/USD Eyes Volatility Ahead of Fed, AU CPI
CSL Slump and Weak Correlations Pressure ASX 200
ASX 200 Market Snapshot
- The ASX 200 recorded its worst session in four days, though losses were cushioned by strength in the Financials sector (XFJ).
- Five of eleven ASX sectors advanced, led by Consumer Discretionary and Financials, while six declined — with Health Care (XHJ) and Materials (XMJ) leading losses.
- Health Care and Information Technology have been the weakest-performing ASX sectors over the past 60 trading days.
- A two-bar bearish reversal (dark cloud cover) has formed on the daily chart, again highlighting weakness within the upper wicks of the past two weekly candles.
- Wednesday remains the most volatile trading day, with an average daily range of 79.9 points over the past three months and 75.1 points over the past year.
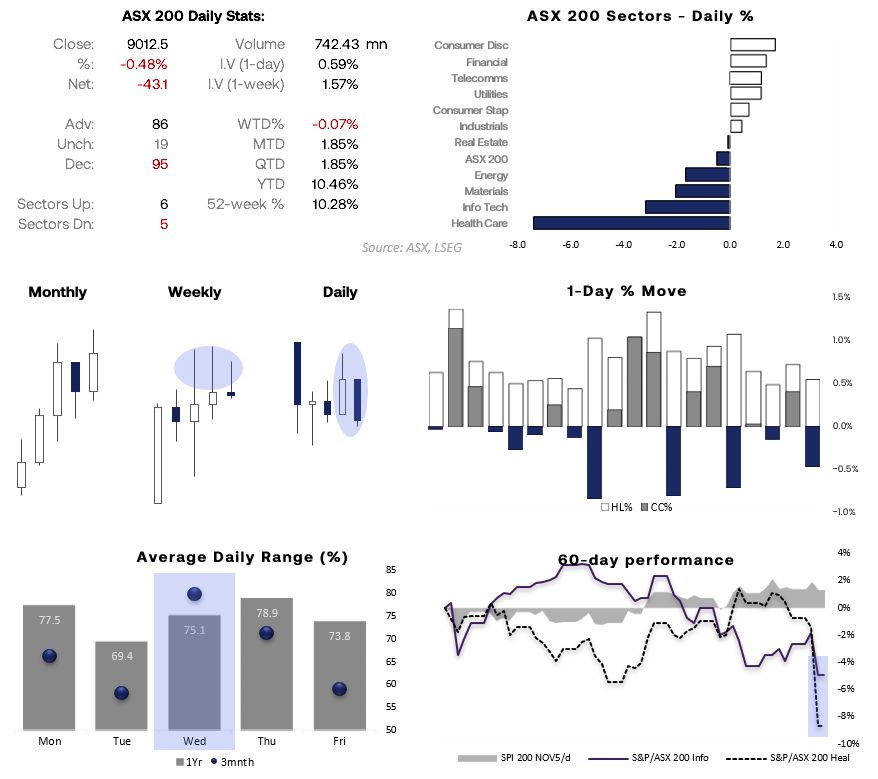
Chart analysis by Matt Simpson - source: ASX, LSEG
CSL Plunges to Six-Year Low as US Immunisation Slump Hits Revenue
Biotech firm CSL fell 15% on Tuesday, suffering its worst day since August following a revenue guidance downgrade. The company cited an unprecedented decline in US immunisation rates and said it has yet to see a bottom. The heavy losses weighed on the broader ASX 200 index, with CSL being the fourth-largest company by market capitalisation.
I noted in Tuesday’s report that the healthcare sector appeared to be rolling over and that CSL was a bellwether stock to monitor. CSL now sits at a six-year low, and further losses could be ahead, with bears likely eyeing a move toward the November 2018 low of 158.43. Also note the 200-month EMA sits at 171.60 for a potential support level along the way.
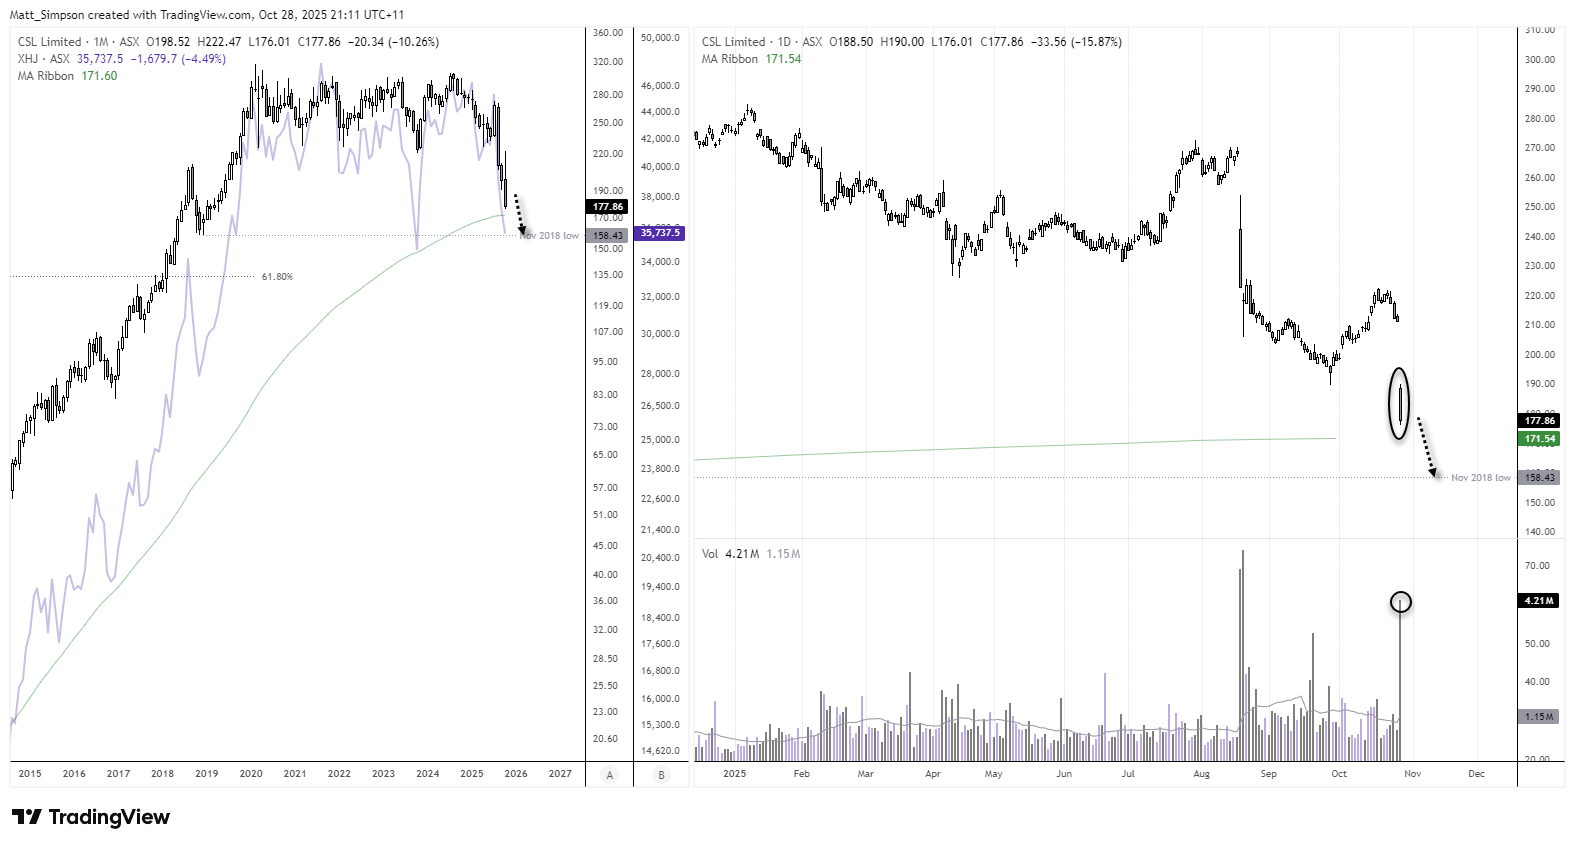
Chart analysis by Matt Simpson – Source: TradingView.

ASX 200 Correlations
The ASX 200 appears to be dancing to its own beat across the 10-, 20-, and 60-day correlations. Its relationship with Wall Street indices has effectively broken down over the past 10 days, with the Nasdaq 100 and S&P 500 pushing to record highs while ASX momentum turns lower. Even the usually solid correlations between the ASX 200 and its two largest sectors — Financials and Materials — are waning. This suggests smaller-cap stocks are driving short-term moves. With Materials beginning to turn, the question is whether the ASX is finally due for a deeper retracement.

Chart analysis by Matt Simpson - data source: ASX, LSEG
ASX 200 Technical Analysis
The two-bar bearish reversal (dark cloud cover) was accompanied by rising volumes on Tuesday, suggesting bears are attempting to regain control of the ASX 200 futures market. The near-term bias favours a move toward 9,000, with a break below that level exposing the 8,950 lows.
However, the 1-hour chart shows support around Thursday’s VPOC (9,033) and the weekly pivot point (9,041). If CPI data proves soft enough to increase expectations of an RBA rate cut today, the ASX could see a short-term rebound on policy optimism.
At that stage, I would reassess the potential for a swing high, with 9,000 remaining the initial downside target.

Chart analysis by Matt Simpson - Source: TradingView, ASX SPI 200 Index Futures
View the full economic calendar
-- Written by Matt Simpson
Follow Matt on Twitter @cLeverEdge
How to trade with City Index
You can trade with City Index by following these four easy steps:
- Open an account, or log in if you’re already a customer
• Open an account in the UK
• Open an account in Australia
• Open an account in Singapore
- Search for the market you want to trade in our award-winning platform
- Choose your position and size, and your stop and limit levels
- Place the trade