


The ASX 200 ended lower for a third consecutive session on Thursday, but price action suggests a possible turning point. A bullish hammer candle on the daily chart and strength in the heavyweight Financials and Materials sectors point to early signs of stabilisation. With volatility easing and SPI 200 futures higher overnight, the correction may be nearing its end.
View related analysis:
- ASX 200 Morning Market Outlook: ASX Dips Again But Bias Remains Bullish
- ASX 200 Morning Market Outlook: Bulls Hesitate Near Record Highs
- ASX 200 Morning Market Outlook: Sectors Support Fresh Breakout
- ASX 200 Morning Outlook: October Brings Bullish Bias and High Volatility
ASX 200 Outlook: Rebound Potential Builds as Bulls Defend Key Support
ASX 200 Market Snapshot
- The ASX 200 closed lower for a third day, though its lower tail and bullish hammer candle on the daily chart suggest a near-term inflection point
- While 7 of the 11 ASX 200 sectors declined, the heavyweight financials and materials sectors gained to help support the broader market
- The ASX 30-day implied volatility index was also lower for a second day to suggest bulls are considering their next round of risk-on
- With ASX 200 futures (SPI 200) higher overnight, perhaps the end of the correction is here

Chart analysis by Matt Simpson - data source: ASX, LSEG
ASX 200 Sector Analysis
Last week I noted that ASX sectors were broadly supportive of a breakout in the index to a new record high. While the ASX 200 came close, it ultimately fell short — and has since delivered a three-day pullback. Still, as long as Financials (XFJ) and Materials (XMJ) continue to trend higher, the odds remain tilted toward an eventual bullish breakout for the ASX 200. However, if the smaller sectors fail to rebound or continue drifting lower, it could make for a tougher climb for ASX 200 bulls overall.
The Consumer Discretionary (XDJ) sector has now turned lower, signalling renewed caution among cyclical names. The Energy (XEJ) sector is also testing support and reconsidering a break to new cycle lows, putting to question whether a sustainable swing low has already been established. Momentum across Information Technology (XIJ), Communication Services (XTJ), and Consumer Staples (XSJ) also points south, suggesting the broader market may need a reset before another leg higher.
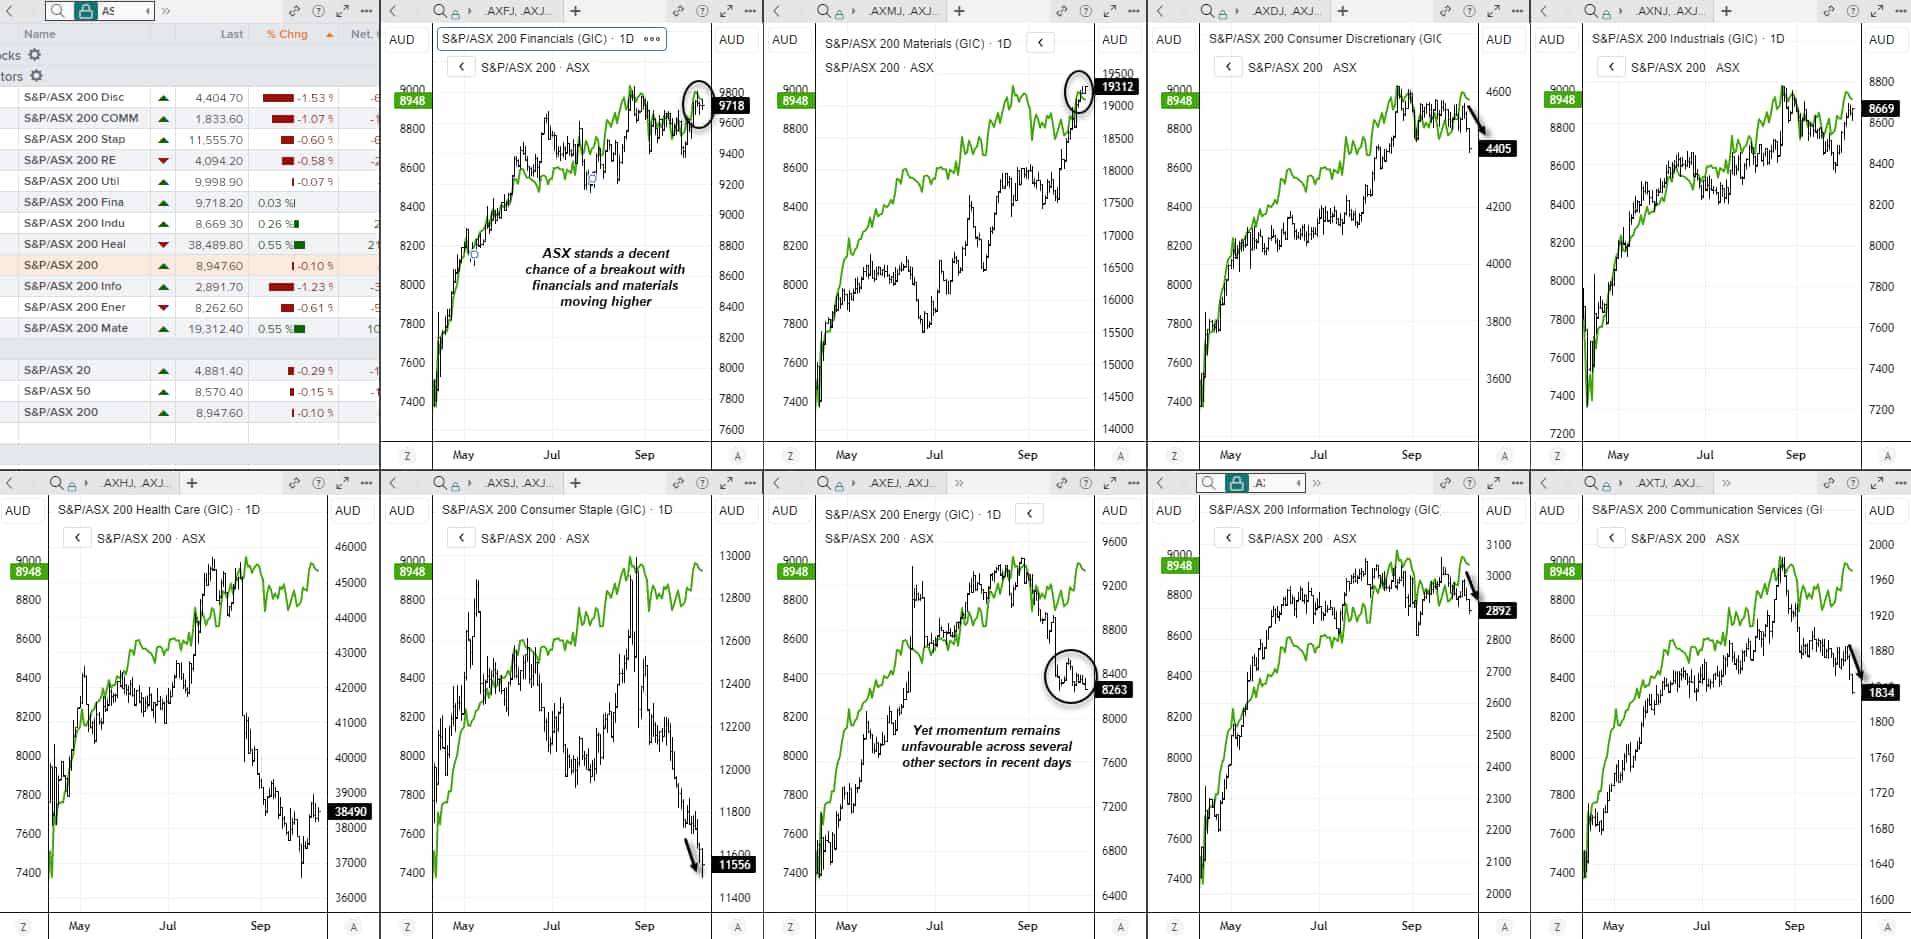
Chart analysis by Matt Simpson - Source: ASX LSEG

ASX 200 Futures (SPI 200) Technical Analysis
The daily chart shows a modest pullback following last week’s brief record high. The RSI (14) continues to trend higher without reaching overbought territory, signalling that momentum remains constructive. ASX bulls also have a positive lead from Wall Street, with the S&P 500 and Nasdaq futures setting fresh record highs overnight.
That said, heading into the weekend could bring choppy conditions. The one-hour chart highlights that prices are oscillating around the 9,000 level — a range that has proven unreliable as either firm support or resistance.
Given the breach of the prior one-hour swing high, dips remain preferred for bullish setups. However, with prices hovering close to the 9,000 zone, a brief dip beneath it would be preferable before considering fresh longs, with 9,040 and 9,065 as potential upside targets.

Chart analysis by Matt Simpson - Source: TradingView, ASX SPI 200 Index Futures
View the full economic calendar
-- Written by Matt Simpson
Follow Matt on Twitter @cLeverEdge
How to trade with City Index
You can trade with City Index by following these four easy steps:
- Open an account, or log in if you’re already a customer
• Open an account in the UK
• Open an account in Australia
• Open an account in Singapore
- Search for the market you want to trade in our award-winning platform
- Choose your position and size, and your stop and limit levels
- Place the trade


