


The ASX 200 was steady on Tuesday despite sector rotation beneath the surface. Financials extended their pullback to weigh on index performance, while Materials hit a fresh record high thanks to gains from BHP, Rio Tinto, and Fortescue. Internals were mixed, though improving breadth and a fading bearish tone suggest downside momentum may be waning midweek.
View related analysis:
- ASX 200 Morning Market Outlook: Post-Selloff Rebound Looks Fragile
- ASX 200 Morning Market Outlook: SPI Futures Track Wall Street Lower
- Nasdaq, Crude Oil Plunge Amid Trump-Tariff Revival as Gold Holds Firm
- AUD/USD, USD/JPY: Mild Rebound for Australian Dollar and Yen Faces Resistance
ASX 200 Market Snapshot: Mixed Internals and Fading Bearish Momentum
ASX 200 Market Snapshot
- The ASX 200 formed a doji on Tuesday and narrowly closed above its 20-day EMA.
- Its daily range was the second largest in seven days, suggesting bearish momentum is waning.
- Internals were mixed — which can be seen as a sign of strength given Monday’s sell-off — with five of the eleven sectors advancing and fewer than half (87) of ASX stocks declining.
- Wednesday has produced the highest average daily cash range of the week over the past three months (77.3 points).
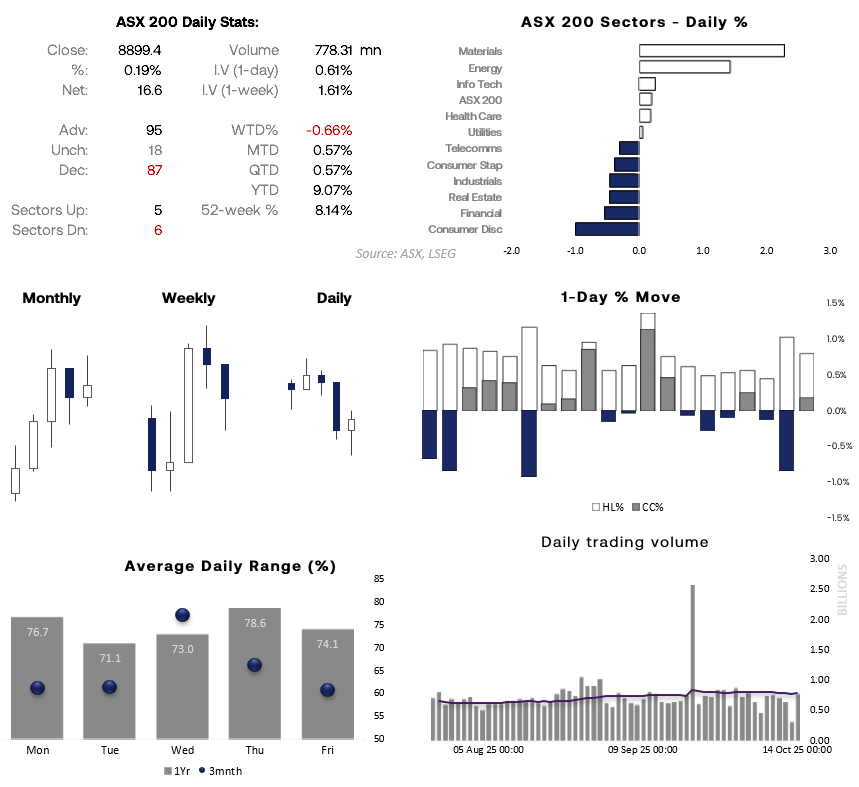
Chart analysis by Matt Simpson - data source: ASX, LSEG
ASX 200 Sector Analysis: Materials Lead While Financials Falter
The ASX 200 Materials sector (XMJ) continued its powerful advance, reaching a fresh record high on Tuesday. BHP Group climbed 2.2%, while Fortescue (FMG) and Rio Tinto (RIO) rose 1.8%.
Meanwhile, the Financials sector (XFJ) declined for a second straight session — marking its weakest performance in nearly three weeks. Price action across the big four banks suggests near-term volatility may precede any resumption of the broader uptrend.
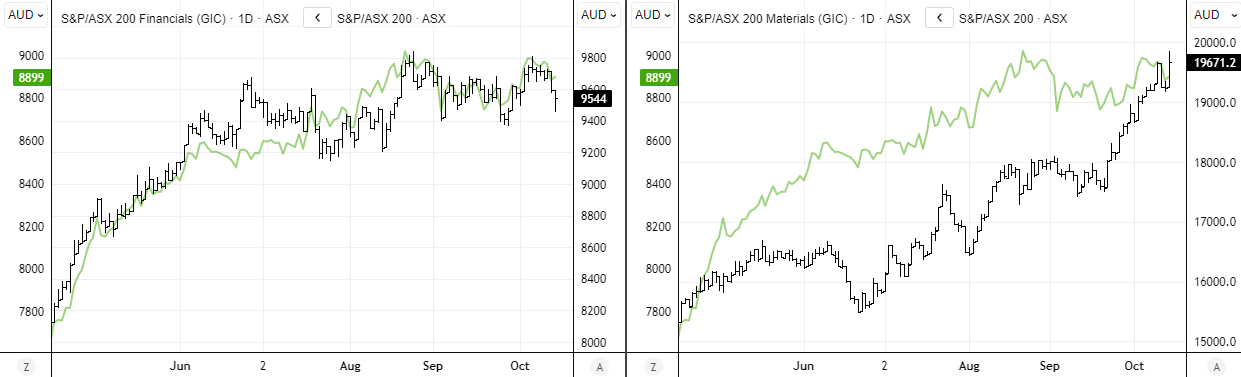
Chart analysis by Matt Simpson - data source: ASX, LSEG
- Commonwealth Bank (CBA) initially fell -2% to a 5-month low before recovering back above the September high and forming a bullish hammer candle. If it is going to bounce and help prop up the sector (it is the largest market cap of the financials and ASX 200, afterall) – then it needs to get its skates on.
- Westpac (WBC) was the worst performer of the big four with a -1.2% decline. Momentum is not currently favouring bullish setups, though bearish momentum is already losing steam with half of Tuesday’s range being a lower wick. Perhaps it can find some stability above the September low (37.41) or 50-day EMA (37.70)
- National Australia Bank (NAB) reached an intraday 6-week low before parring earlier losses to close the day back above its monthly S1 pivot (42.40) and 50-day EMA (42.54)
- ANZ reached an intraday record high, though its shooting star candle after an extended run suggests some mean reversion lower could be due.
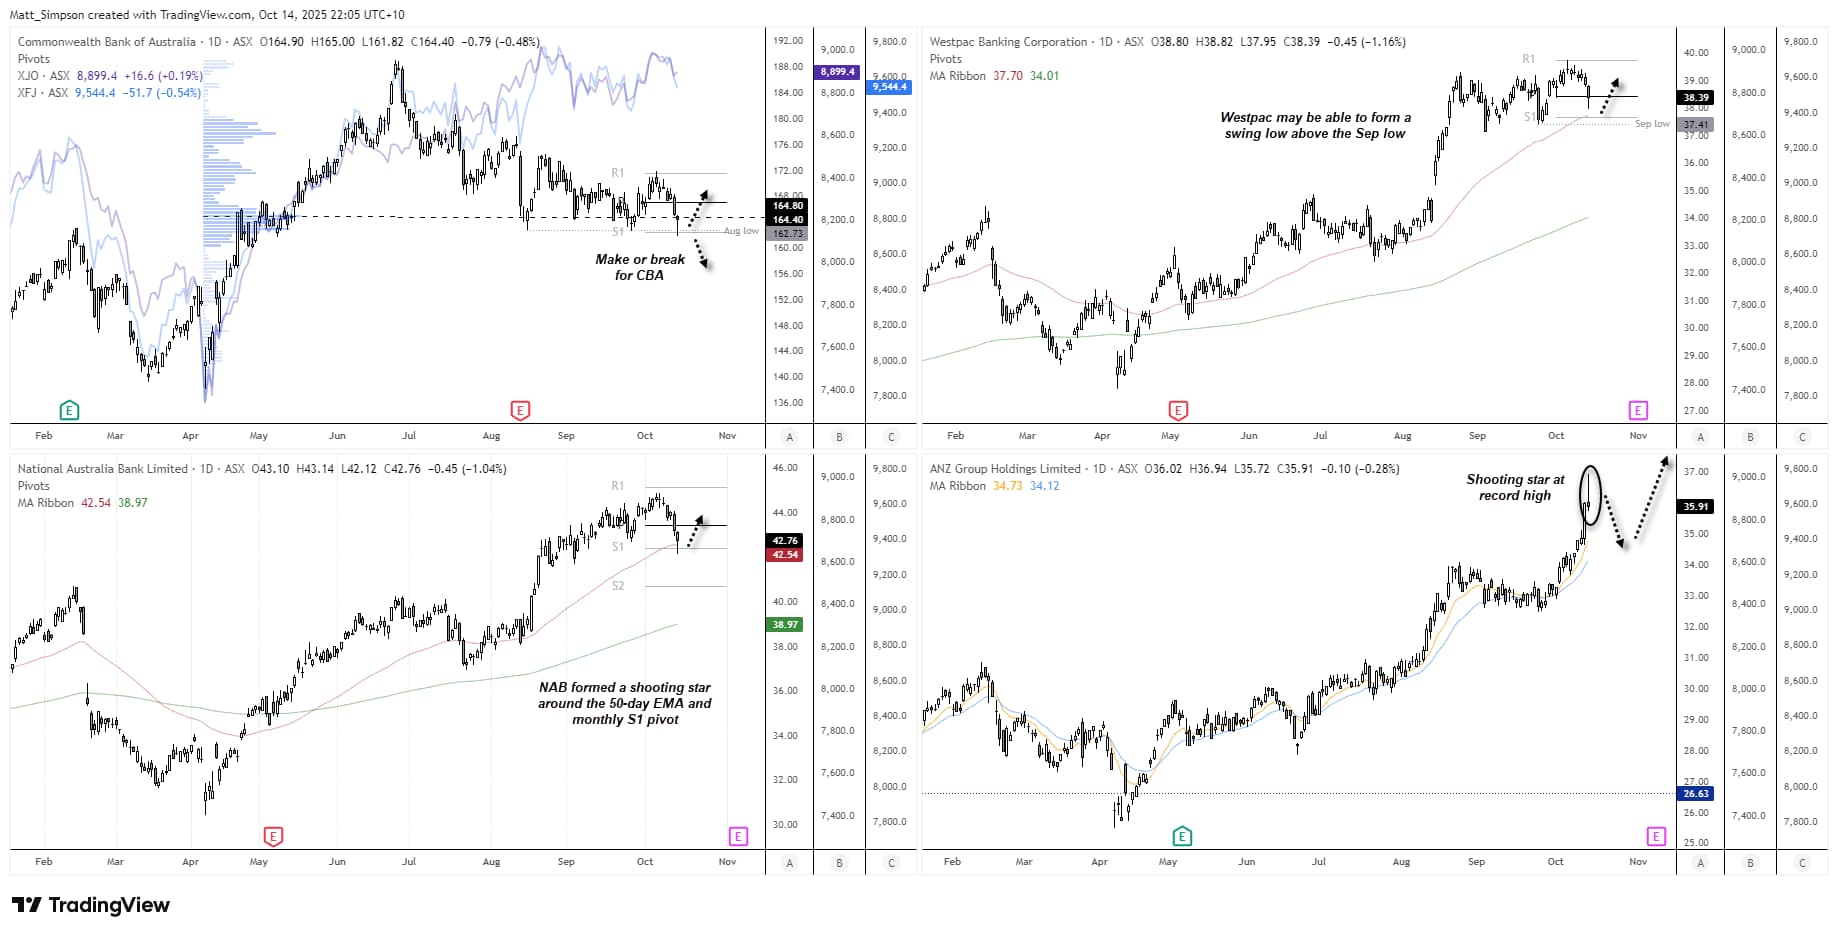
Chart analysis by Matt Simpson - data source: ASX, TradingView

ASX 200 Technical Analysis
Despite weaker internals and a lacklustre performance on Tuesday, ASX 200 futures surged overnight following dovish remarks from Jerome Powell. Strong earnings from Goldman Sachs also buoyed global financials, which could bode well for the local market at today’s open.
The daily chart shows that ASX futures formed a small doji around the 50-day EMA and monthly pivot, before bullish range expansion took hold overnight. On the 1-hour chart, price extended through both the monthly R1 and weekly pivot, and is now consolidating around the 9,000 handle.
Once cash-market trade begins, I’ll be looking to see whether futures can establish support above the 200-hour EMA (8,950) — potentially setting up a continuation move towards 9,040.
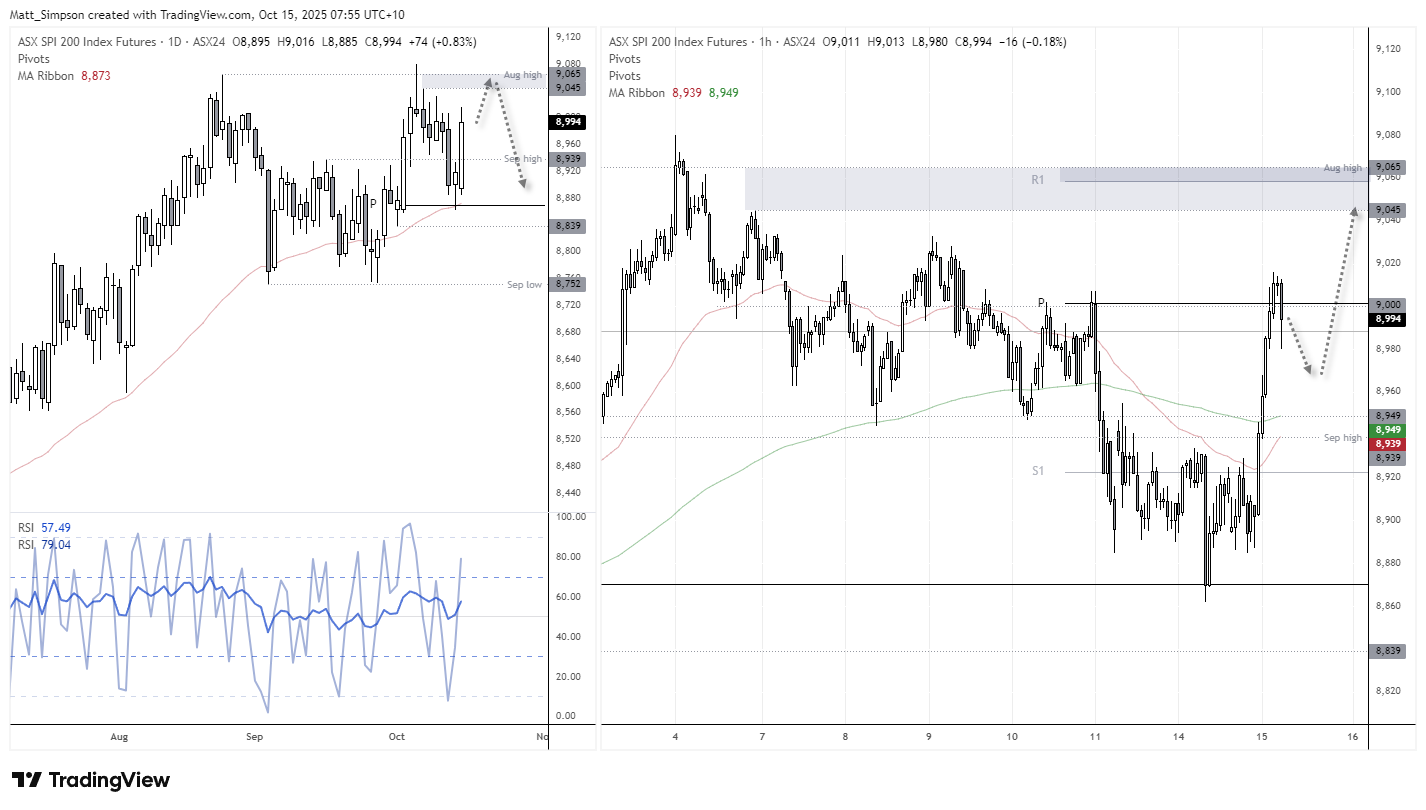
Chart analysis by Matt Simpson - Source: TradingView, ASX SPI 200 Index Futures
View the full economic calendar
-- Written by Matt Simpson
Follow Matt on Twitter @cLeverEdge
How to trade with City Index
You can trade with City Index by following these four easy steps:
- Open an account, or log in if you’re already a customer
• Open an account in the UK
• Open an account in Australia
• Open an account in Singapore
- Search for the market you want to trade in our award-winning platform
- Choose your position and size, and your stop and limit levels
- Place the trade


