


The ASX 200 began the week on a firm note, lifted by strong gains across the financial and real estate sectors. Despite declines in materials and healthcare, the index added 0.4% as investors showed renewed confidence in banks and property stocks. Commonwealth Bank’s sharp rebound underscores improving sentiment in the sector, though lingering caution remains ahead of Tuesday’s typically subdued trading session.
View related analysis:
- ASX 200 Morning Market Outlook: Bad News Is Good News for ASX
- ASX 200 Morning Market Outlook: Fortescue Breakout, Materials Rally
- ASX 200 Morning Market Outlook: Financials Hinder ASX Performance
- ASX 200 Morning Market Outlook: SPI Futures Track Wall Street Lower
ASX 200 Opens the Week Firmly as Financials Drive Momentum
ASX 200 Market Snapshot
- Nine of the eleven ASX 200 sectors advanced on Monday, led by Financials (XFJ +1.5%) and Real Estate (XRE +1.1%).
- Only Materials (XMJ –1.4%) and Health Care (XHJ –0.2%) declined.
- With the two largest sectors diverging, the ASX 200 managed only a modest gain of 0.4%.
- This reflects a cautious start to the week, with prices edging higher into the upper wick of last week’s doji candle.
- Caution may persist today, as Tuesdays have averaged the lowest daily range over the past year (71 points) and the past three months (61.5 points).

Chart analysis by Matt Simpson - data source: ASX, LSEG
ASX 200 Sector Analysis
The top five ASX 200 sectors account for just over 75% of the index weighting. Four of those sectors remain in strong uptrends, which combined accounts for 69% of the index weighting. And until we see the tide turn on these sectors, the ASX seems more likely to press higher than not.
While there is some noise among Financials (XFJ) and materials (XMJ), they both remain near record highs. Commonwealth Bank (CBA) – the largest stock of its sector and index, rose 2.6% to a 7-week high to further suggest its corrective low has been seen. While the materials sector turned lower from its record, Fortescue (FMG) remained above $20 having broke out of the bullish triangle mentioned last week. Its trend and therefore my bias remains bullish. Rio Tinto (RIO) also remains near its cycle highs.
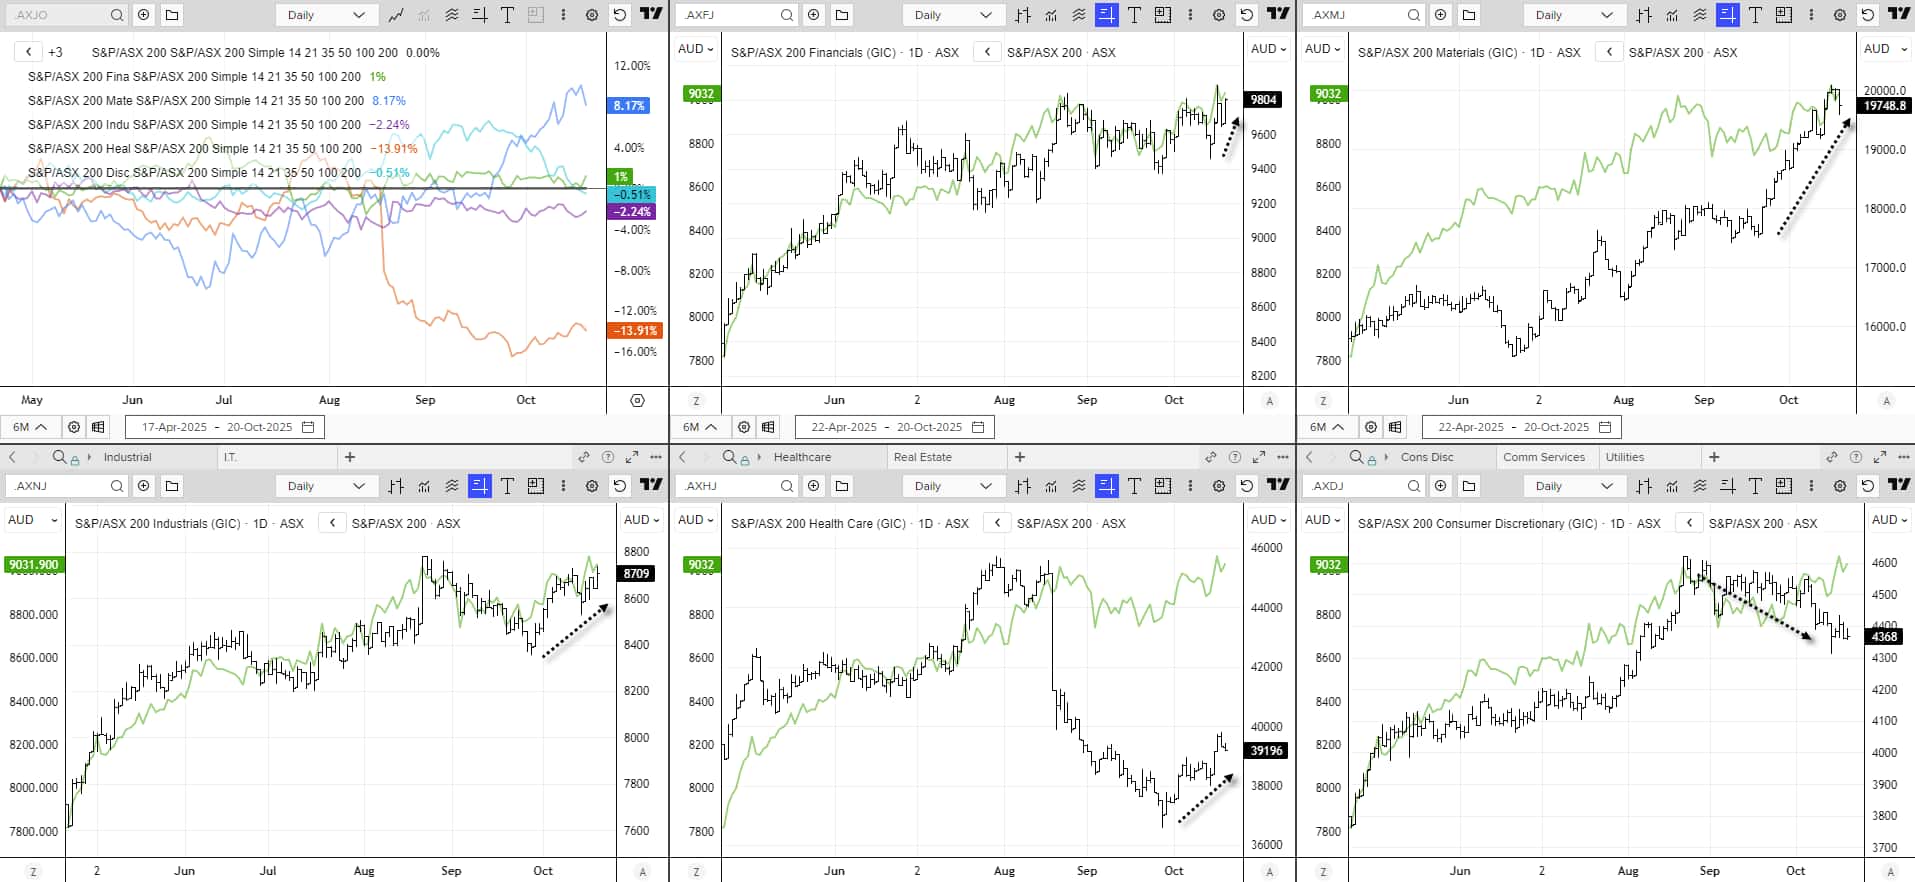
Chart analysis by Matt Simpson - data source: ASX, LSEG

ASX 200: Commonwealth Bank (CBA)
A textbook bullish trend remains intact on CBA’s weekly and monthly charts. Last week’s long-legged doji found support at the 50-week SMA, with prices now trading above that candle’s high and testing the 20-week SMA. The weekly RSI(14) is curling higher from the 50 level, hinting that the next upthrust may be underway.
That said, a multi-month bearish divergence continues to develop on the weekly timeframe — a potential warning sign that the rally could eventually stall. Still, CBA bulls may enjoy further upside in the near term, though weakness across financials could signal fragility in the broader ASX 200.
On the daily chart, CBA has rallied 6.7% from its 200-day EMA after a bullish pinbar triggered a gap higher the following session. The two gaps either side of that hammer form an island reversal, often seen near significant lows. Trading volumes have risen alongside prices since that low and have remained above average for three consecutive days. Bulls may look to buy dips above Friday’s low, near the weekly pivot point, and retain an open upside target.

Chart analysis by Matt Simpson - Source: TradingView, Commonwealth Bank of Australia (CBA)
View the full economic calendar
-- Written by Matt Simpson
Follow Matt on Twitter @cLeverEdge
How to trade with City Index
You can trade with City Index by following these four easy steps:
- Open an account, or log in if you’re already a customer
• Open an account in the UK
• Open an account in Australia
• Open an account in Singapore
- Search for the market you want to trade in our award-winning platform
- Choose your position and size, and your stop and limit levels
- Place the trade


