


The ASX 200 extended its decline on Thursday, closing lower for a third consecutive session and erasing all gains from the past two months. While downside momentum appears to be slowing, internal sector ratios — such as Consumer Discretionary versus Staples and Materials versus Technology — are flashing warnings of structural weakness beneath the surface. With inflation pressures lingering and bond yields rising, cyclical sectors continue to underperform defensives, suggesting rallies may remain capped in the near term.
View related analysis:
- ASX 200 Morning Market Outlook: Woolworths (WOW) Set To Bounce?
- Gold Shows Tentative Signs Of Stability, Options Hint At Mild Recovery
- ASX 200 Morning Market Outlook: Westpac (WBC) Leads Big 4 Lower Post-CPI
- ASX 200 Morning Market Outlook: CSL Plunge Drags ASX lower
ASX 200 Sector Ratios Reveal Structural Fragility
ASX Consumer Discretionary (XDJ) / Consumer Staples (XSJ) Ratio
The Consumer Discretionary (XDJ) to Consumer Staples (XSJ) ratio provides a gauge of risk appetite and effectively represents cyclicals versus defensives within the ASX 200. It’s notable that the XDJ/XSJ ratio is trending lower during this pullback, signalling a risk-off mood across the broader market. Moreover, the ratio has formed a lower high and broken below its previous swing low, marking a potential change in trend.
When viewed alongside the individual sectors, Consumer Discretionary (blue) has fallen sharply with the ASX 200, while Consumer Staples (purple) has been trending higher. This divergence doesn’t bode well for the ASX if the XDJ/XSJ ratio continues to weaken, as it suggests rallies may remain capped in the near term.
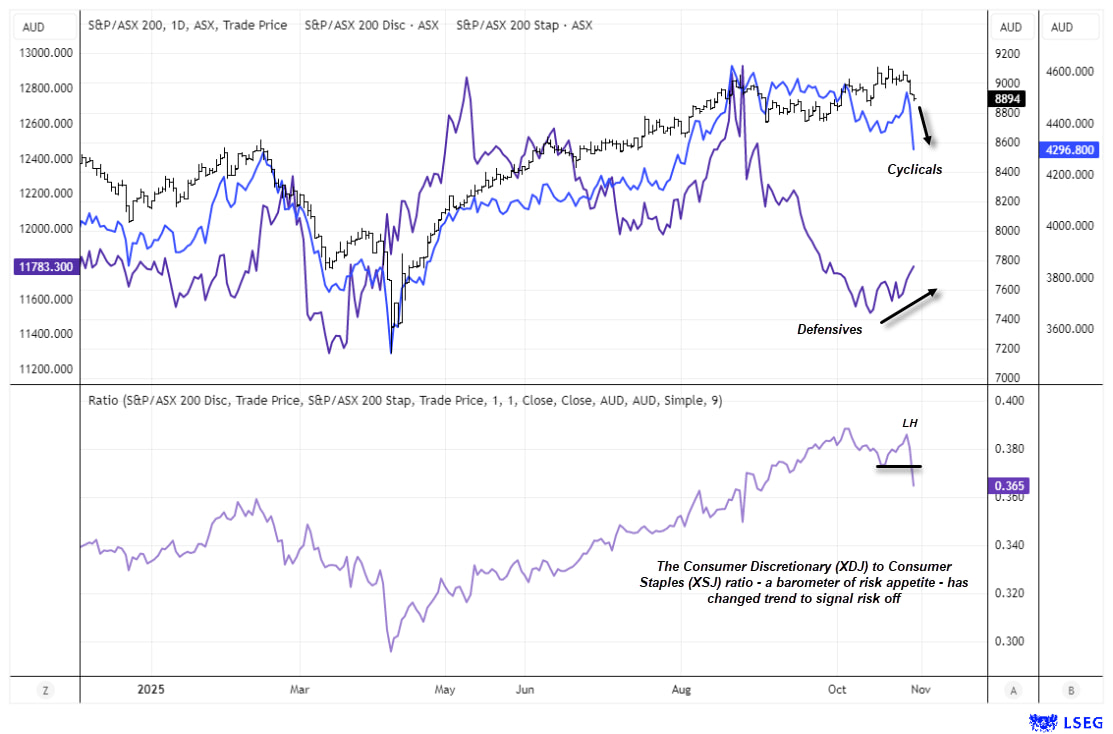
Chart analysis by Matt Simpson - data source: ASX, LSEG

ASX Materials (XMJ) / Information technology (XIJ)
Another useful ratio to monitor is Materials versus Technology. The ASX Materials sector (blue) remains in a solid uptrend, broadly aligned with the strength in commodity markets, while Technology — typically a growth- and risk-sensitive sector — has been topping out since July.
This divergence has driven the XMJ/XIJ ratio sharply higher since the tech sector’s July peak. With Australian CPI surprising to the upside in Q3 and bond yields rising, it’s hard to see this ratio reversing lower any time soon — another factor suggesting the ASX 200 may have topped for now.
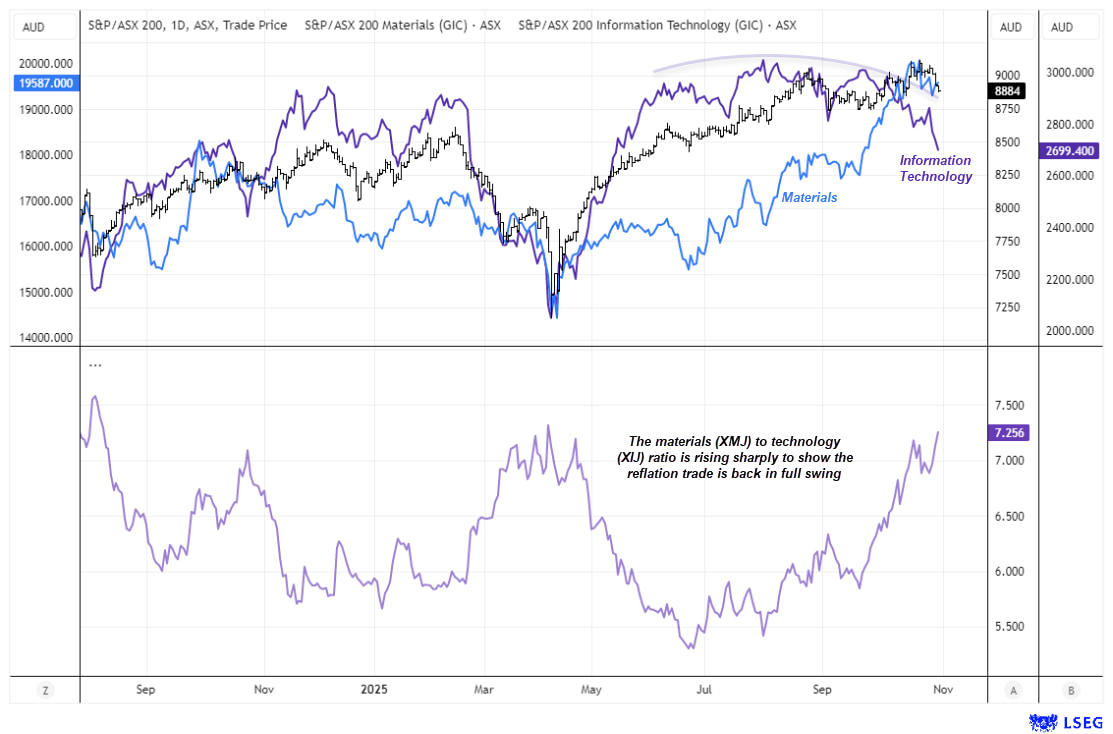
Chart analysis by Matt Simpson - data source: ASX, LSEG
ASX 200 Market Snapshot
- The ASX 200 closed lower for a third straight session, erasing all gains from the past 60 days, though bearish momentum appears to be slowing.
- The monthly candle is on track to form a shooting star, warning that a larger bearish reversal could be developing.
- Consumer Discretionary (XDJ) led seven sectors lower, sliding 4.2% — its worst daily performance in six months.
- Wesfarmers (WES) plunged 7% to a 12-week low, marking its worst day in two and a half years, and was the biggest decliner across both the ASX 200 and the Consumer Discretionary sector.
- Real Estate (XRE) fell 2.3%, with sentiment still weighed by the RBA’s high-for-longer policy stance following Wednesday’s strong CPI report.
- Information Technology (XIJ) dropped 1.5%, underscoring the broad risk-off tone across the market.
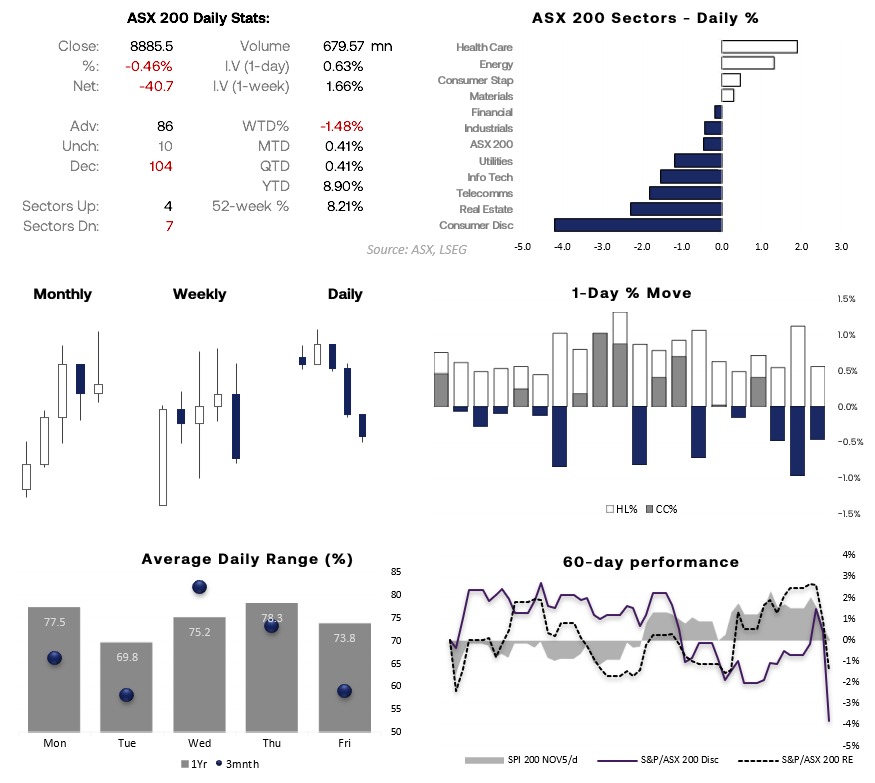
Chart analysis by Matt Simpson - source: ASX, LSEG

Woolworths (WOW) surges to a 2-month high
Last Thursday I outlined a bullish bias for Woolworths (WOW), and it has not disappointed. While prices initially spiked lower on Wednesday, losses were brief before a strong bullish reversal unfolded, with shares closing at the session high for a 2.4% gain.
A gap higher on Thursday was followed by continued upside, suggesting we may have seen a breakaway gap — a pattern that typically forms when prices break out from major lows and mark the start of a new short-term trend.
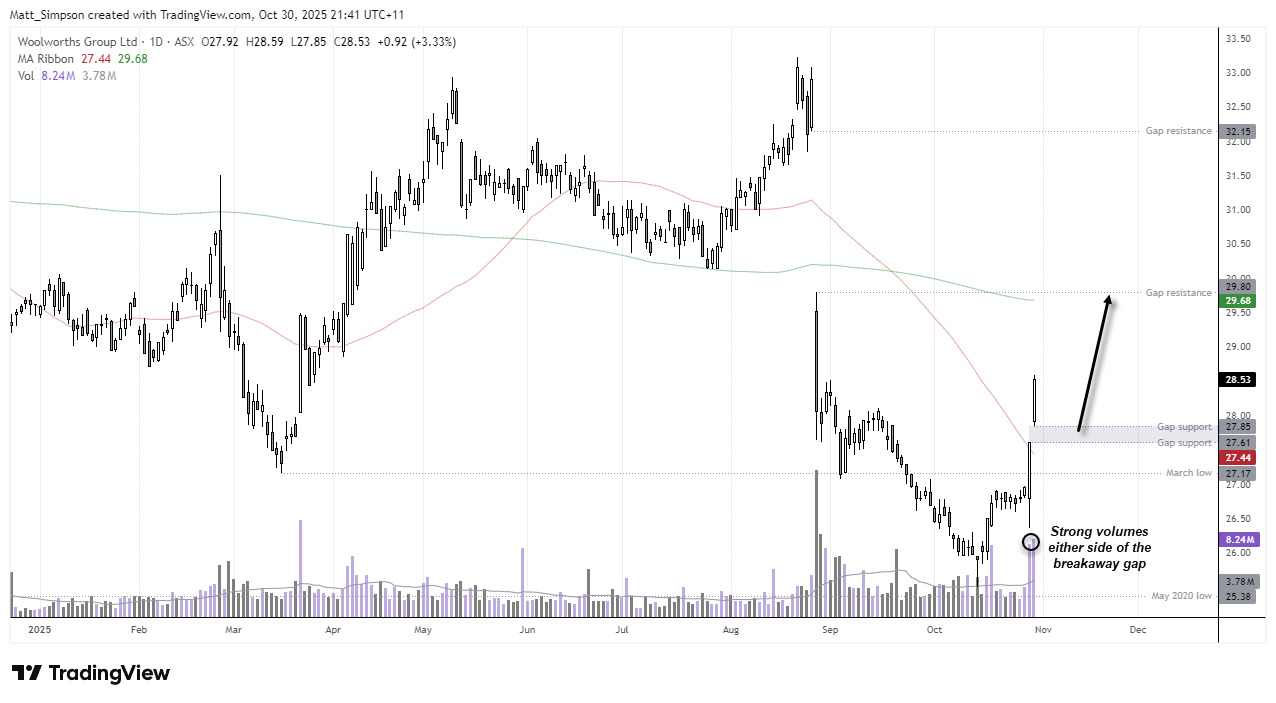
Chart analysis by Matt Simpson - data source: TradingView
ASX 200 Technical Analysis
Price action on the ASX 200 weekly chart is looking increasingly bearish. Momentum has turned lower following the formation of a wide-legged spinning top doji and a small shooting star near record highs, while a multi-month bearish divergence has developed on both the RSI (14) and RSI (2) indicators.
Combined with the risk-off signals seen in the ASX 200’s internal ratios, this suggests the market may be entering the early stages of a correction, with bears likely to fade into rallies. A move back towards the February high (8,615), 50-week SMA (8,455), or even the 8,200 handle appears possible in the coming weeks.
If that sounds excessive, it’s worth noting that none of these targets even reach the 38.2% Fibonacci retracement of the rally from the April low to the October high — a perfectly normal pullback in trending markets. For context, a decline from the October high to the 50-week SMA would represent a 7.2% correction, compared with the 17.8% pullback that followed the February peak.
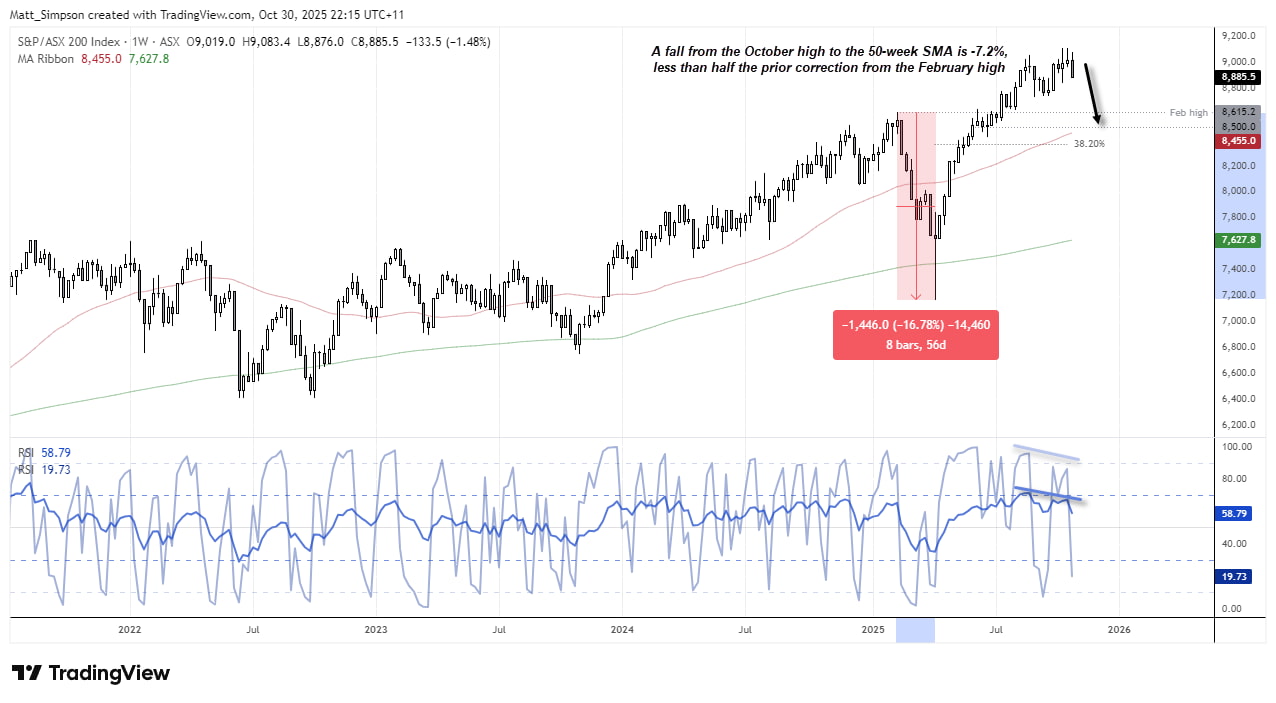
Chart analysis by Matt Simpson - Source: TradingView, S&P/ASX 200 Index
View the full economic calendar
-- Written by Matt Simpson
Follow Matt on Twitter @cLeverEdge
How to trade with City Index
You can trade with City Index by following these four easy steps:
- Open an account, or log in if you’re already a customer
• Open an account in the UK
• Open an account in Australia
• Open an account in Singapore
- Search for the market you want to trade in our award-winning platform
- Choose your position and size, and your stop and limit levels
- Place the trade


