


The ASX 200 surged through the 9,000 level on Wednesday, its best performance in over eight weeks. Price action across major sectors suggests the breakout could have more room to run, with materials, industrials, and financials leading momentum while energy and real estate show signs of recovery.
View related analysis:
- ASX 200 Morning Outlook: October Brings Bullish Bias and High Volatility
- ASX 200 Morning Market Outlook: ASX Snaps 5-Month Winning Streak
- USD/JPY Falls For Fourth Day As Japanese Yen Bulls Remain Dominant
- Australian Dollar Price Action Setups: AUD/USD, AUD/JPY, GBP/AUD
ASX 200 Outlook: Sector Strength Reinforces Breakout
ASX 200 Market Snapshot
- Wednesday’s bullish breakout and 1.1% gain was the best performance for the ASX 200 in over eight weeks
- Up 2.3% from Friday’s close, the ASX 200 is on track for its best week in eight or its most volatile week in four
- 146 (76%) stocks advanced to show breadth behind the rally, 42 (21%) declined, 12 (6%) were unchanged
- Healthcare, materials and financials led the 8 sectors higher, while the 3 sectors that declined only saw marginal losses
- Despite the strong breakout, the ASX has clearly lagged behind the DAX and Nikkei over the past 60 days

Chart analysis by Matt Simpson - data source: ASX, LSEG

ASX 200 Sector Analysis
The ASX 200 materials sector leads the index higher with an 18% rally year-to-date, now back above 19,000 and trending towards record highs.
The industrials sector has rebounded from last week’s low, suggesting its correction from the August peak may be complete, with potential for a move above 8,800.
The ASX 200 financials sector remains closely correlated with the broader index. Its latest rebound signals a cycle low could be in place, with momentum building towards a new high.
The real estate sector has formed a higher low above 4,000, with momentum shifting higher alongside the broader market, hinting that its corrective phase has ended.
The energy sector is showing signs of a potential double bottom, pointing to at least a short-term bounce if not a broader recovery in line with the ASX 200.
Meanwhile, the consumer discretionary sector has seen only a shallow retracement, which suggests the uptrend may soon resume.
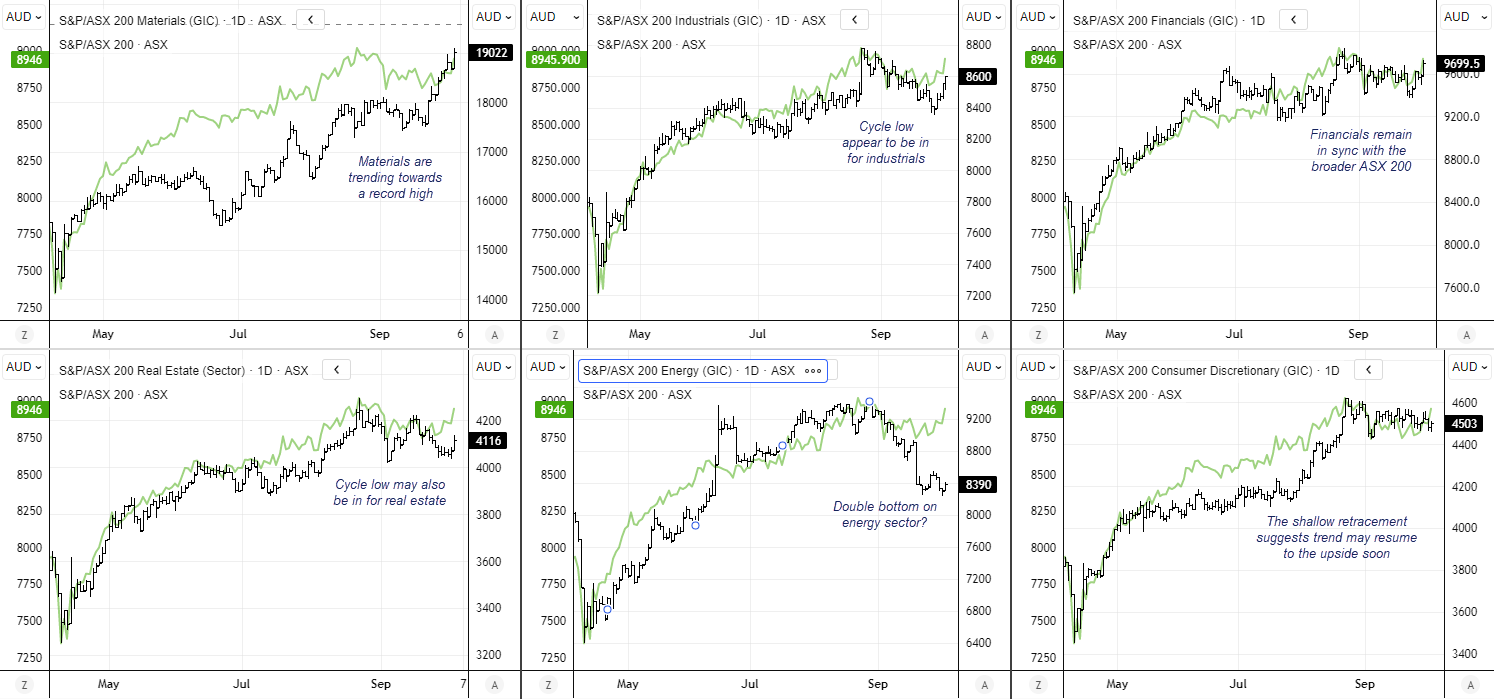
Chart analysis by Matt Simpson - data source: ASX, LSEG
ASX 200 Technical Analysis
Thursday’s bullish breakout was constructive, though it is less than ideal that it occurred on below-average volume. And while the ASX 200 tagged the 9,000 target, prices appear hesitant to push higher for now. Also note that the daily RSI (2) reached heavily overbought territory on the breakout day, warning of a possible near-term pause. That said, the RSI (14) is not overbought and is confirming the rally, so my bias remains for an eventual retest and break to new highs.
Bulls could seek dips towards the 8,900 area in anticipation of a move back to the all-time high (ATH). Note the 8,793–8,979 resistance zone nearby, which is comprised of the cash market and overnight VPOCs (volume point of controls). The upper 1-standard deviation band for the 1-week VWAP is also near the September high (8,939) for potential support, while Wednesday’s overnight VPOC and weekly VWAP sit around 8,899–8,909.
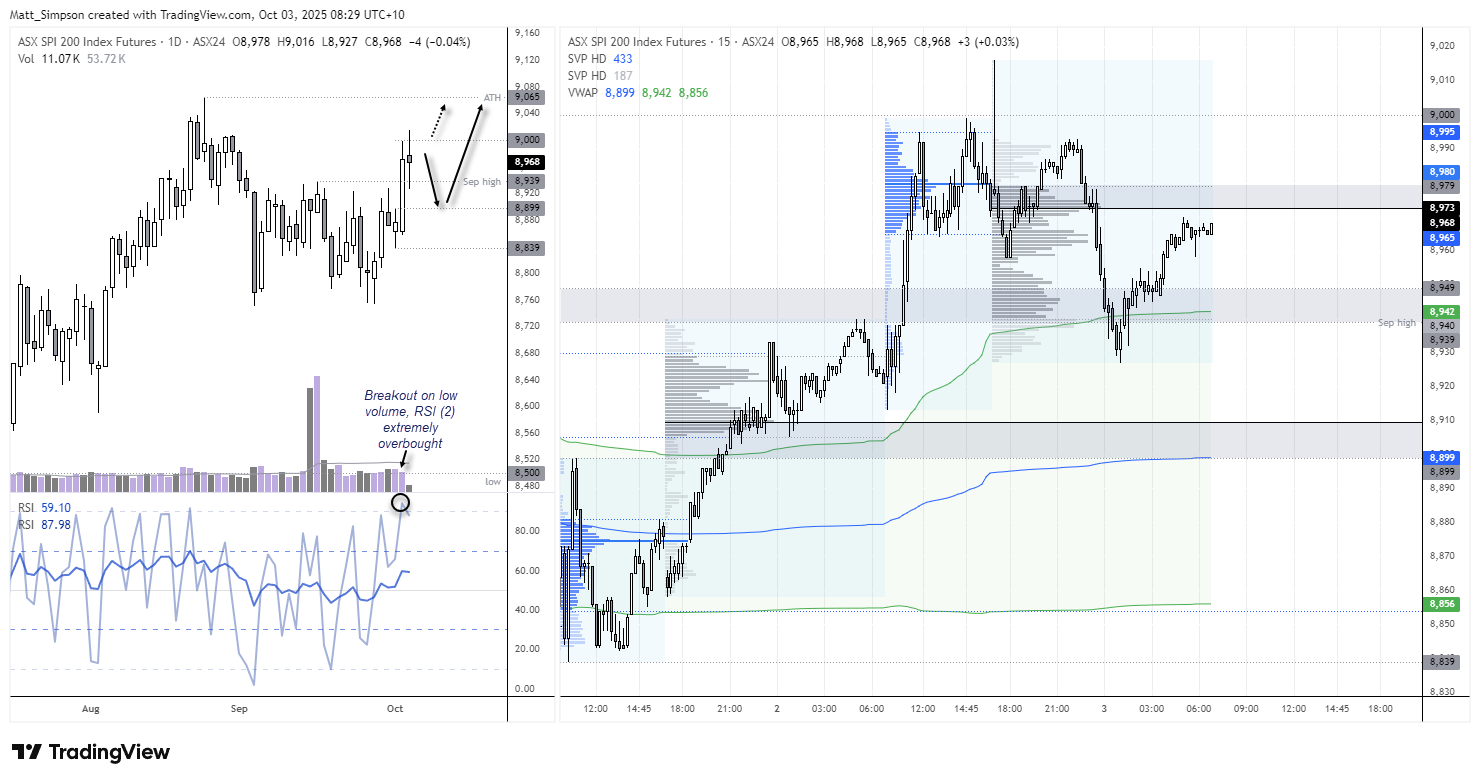
Chart analysis by Matt Simpson - Source: TradingView, ASX SPI 200 Index Futures
View the full economic calendar
-- Written by Matt Simpson
Follow Matt on Twitter @cLeverEdge
How to trade with City Index
You can trade with City Index by following these four easy steps:
- Open an account, or log in if you’re already a customer
• Open an account in the UK
• Open an account in Australia
• Open an account in Singapore
- Search for the market you want to trade in our award-winning platform
- Choose your position and size, and your stop and limit levels
- Place the trade


