


The ASX 200 rallied modestly on Thursday, snapping a three-day losing streak as Materials (XMJ) reached a record high. However, ASX 200 futures (SPI 200) turned lower overnight alongside Wall Street indices, as traders booked profits ahead of the weekend and the start of US earnings season. With volatility typically rising on Fridays, short-term traders should brace for potential swings as Financials continue to soften.
View related analysis:
- ASX 200 Morning Market Outlook: Financials and Materials Hold Firm
- ASX 200 Morning Market Outlook: ASX Dips Again But Bias Remains Bullish
- ASX 200 Morning Market Outlook: Bulls Hesitate Near Record Highs
- ASX 200 Morning Market Outlook: Sectors Support Fresh Breakout
ASX 200 Outlook: Bulls Lose Momentum as SPI Futures Follow Wall Street
ASX 200 Market Snapshot
- The ASX 200 rose on Thursday in line with my bias, snapping a three-day losing streak, although the 0.25% gain was modest.
- The ASX 200 cash market is on track to finish the week with a spinning-top doji candle if prices hold near current levels.
- Seven of the eleven sectors advanced, led by Materials (XMJ), which closed at a record high.
- Four sectors declined, led by Utilities (XUJ) and Financials (XFJ).
- However, ASX 200 futures (SPI 200) were lower overnight alongside Wall Street indices as traders squared up their books ahead of the weekend and US earnings season.
- Historical data shows that Fridays are typically the second most volatile day of the week, based on both the one-year and three-month average daily ranges.

Chart analysis by Matt Simpson - data source: ASX, LSEG

ASX 200 Sector Analysis: Financials and Materials Diverge
With Financials (XFJ) and Materials (XMJ) together accounting for more than half of the ASX 200’s total weighting, their trends are critical in gauging the index’s broader strength. The Materials sector has reached a fresh record high, while Financials are retracing from near-record levels — a clear sign of divergence between the market’s two heavyweight components.
This split reinforces yesterday’s view that upside on the ASX 200 may be limited in the short term. A brief pullback or period of consolidation may be needed before a sustained breakout to new highs can occur. Traders may therefore wish to stay nimble and avoid assuming an immediate continuation higher while Financials remain under pressure.
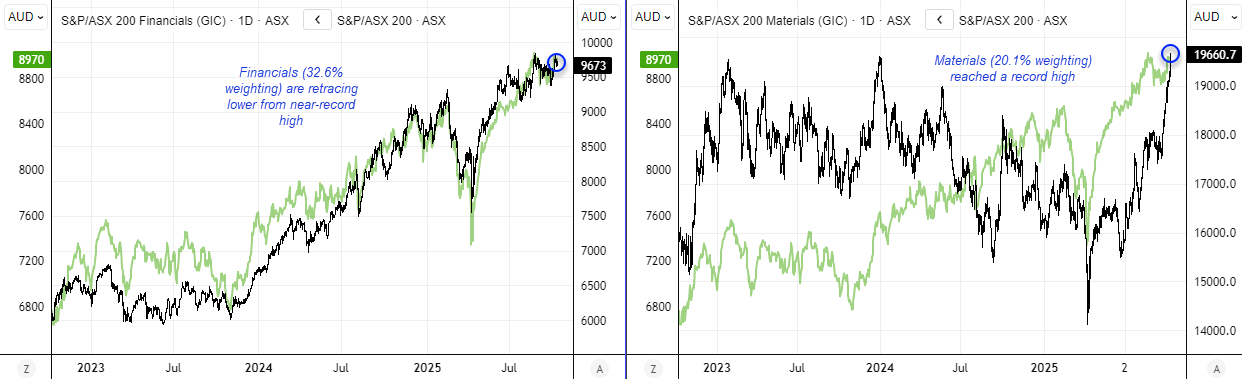
Chart analysis by Matt Simpson - data source: ASX, LSEG
ASX 200 Technical Analysis
The pullback from the recent, short-lived record high continues, with ASX 200 futures once again trading below the 9,000 level and testing the September high near 8,939 for potential support.
The 8,839–8,949 zone may offer initial buying interest, but the one-hour trend structure still leans bearish, suggesting the ASX 200 could extend lower in the near term. The 9,000 handle and monthly R1 pivot (8,989) now form a resistance area that bears may look to fade into. A confirmed break beneath the September high could open the door to a move toward the 8,890 swing high or the monthly pivot point near 8,870.

Chart analysis by Matt Simpson - Source: TradingView, ASX SPI 200 Index Futures
View the full economic calendar
-- Written by Matt Simpson
Follow Matt on Twitter @cLeverEdge
How to trade with City Index
You can trade with City Index by following these four easy steps:
- Open an account, or log in if you’re already a customer
• Open an account in the UK
• Open an account in Australia
• Open an account in Singapore
- Search for the market you want to trade in our award-winning platform
- Choose your position and size, and your stop and limit levels
- Place the trade


