


The ASX 200 pulled back on Wednesday as gold’s sharp sell-off rippled through the materials sector, dragging the broader index lower. However, energy and technology helped cushion losses, and Woolworths (WOW) may be showing the first technical signs of a recovery after weeks of sustained pressure.
View related analysis:
- Australian Dollar Consolidates: AUD/USD, EUR/AUD Near Pivotal Levels
- Gold Suffers Fifth Worst-Day Drop in 55yrs As Momentum Trade Unwinds
- ASX 200 Morning Market Outlook: ASX Hits Record High, Materials Lead
- ASX 200 Morning Market Outlook: Financials Lead Gains as CBA Rebounds
- ASX 200 Morning Market Outlook: Bad News Is Good News for ASX
Woolworths (WOW) Recovery Hopes Amid ASX 200 Sector Rotation
ASX 200 Market Snapshot
- The sharp drop in gold prices on Tuesday weighed on the broader ASX 200 index, which fell 0.7% on Wednesday.
- It was the most volatile session in four days, reinforcing the trend of Wednesdays being the liveliest trading day for the ASX 200 over the past three months.
- A two-bar reversal pattern (dark cloud cover) has now formed around the record high.
- Seven sectors declined, led by Materials (XMJ), which suffered its worst session in six months at –3.1%.
- Four sectors advanced, with Energy (XEJ) and Technology (XIJ) leading gains.
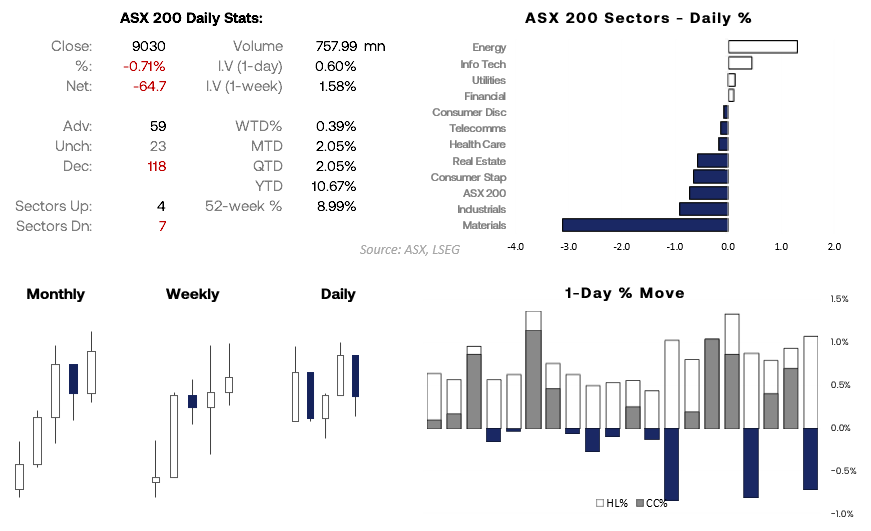
Chart analysis by Matt Simpson - source: ASX, LSEG
ASX 200 Sector Analysis
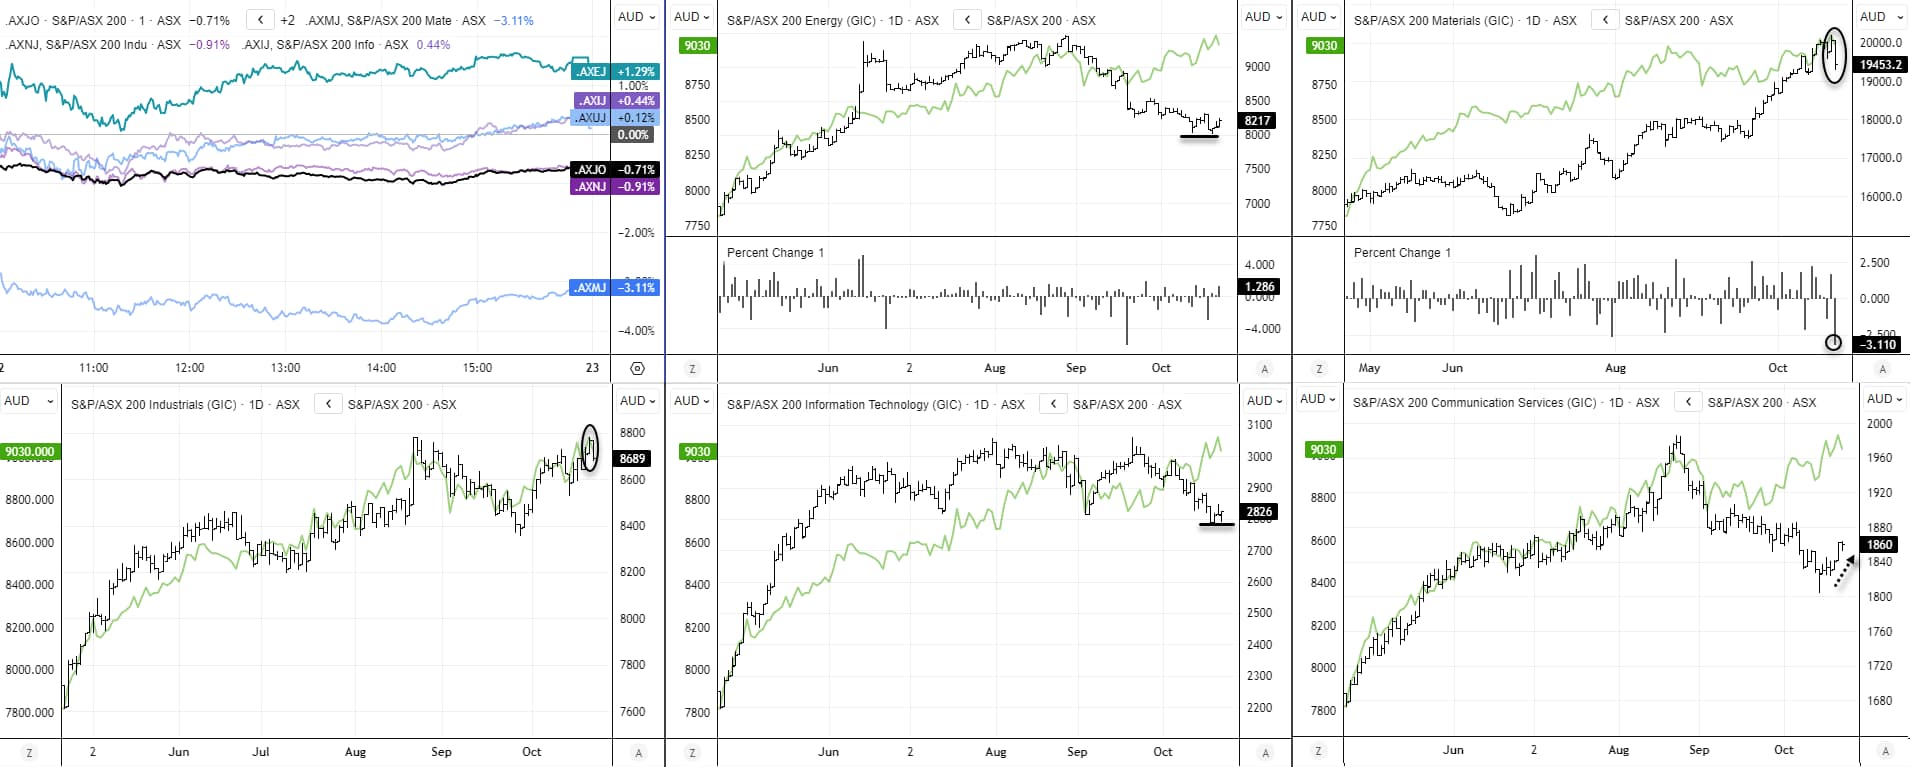
Most of the day’s moves on the ASX occurred at the open, though the materials sector managed to claw back some losses from its intraday low of –4%. Given the likely overreaction in gold after an extended rally, the retracement across materials may also prove limited — as may the sector’s bearish momentum relative to the broader ASX 200 index.
- The technology sector (XIJ) has formed a double bottom near 2800, signalling potential for at least a minor rebound.
- Industrials (XNJ) have rolled over just beneath the August high, suggesting scope for further weakness in the near term.
- Energy (XEJ) may have established a double bottom just above 8000, hinting at a possible rebound.
- While communication services (XTJ) printed a small doji, price action continues to suggest a meaningful low was seen last week, with dips favoured from here.
![]()
Chart analysis by Matt Simpson - source: ASX, LSEG

Woolworth Group (WOW) Technical Analysis
Woolworths fell 26% from its August high to the October low in just eight weeks, with 13% of that decline occurring in a single week. However, last week’s bullish engulfing candle above the May 2020 low signals early signs of stabilisation and potential mean reversion higher.
The daily chart shows a bullish RSI(14) divergence forming ahead of a bullish pinbar and range expansion candle, both supported by higher volume. With prices now consolidating around last week’s high, bulls may seek dips above the weekly pivot (26.35) for a retest of the March low near 27.00. A break above this level would assume a deeper retracement, bringing 28.00 into focus.
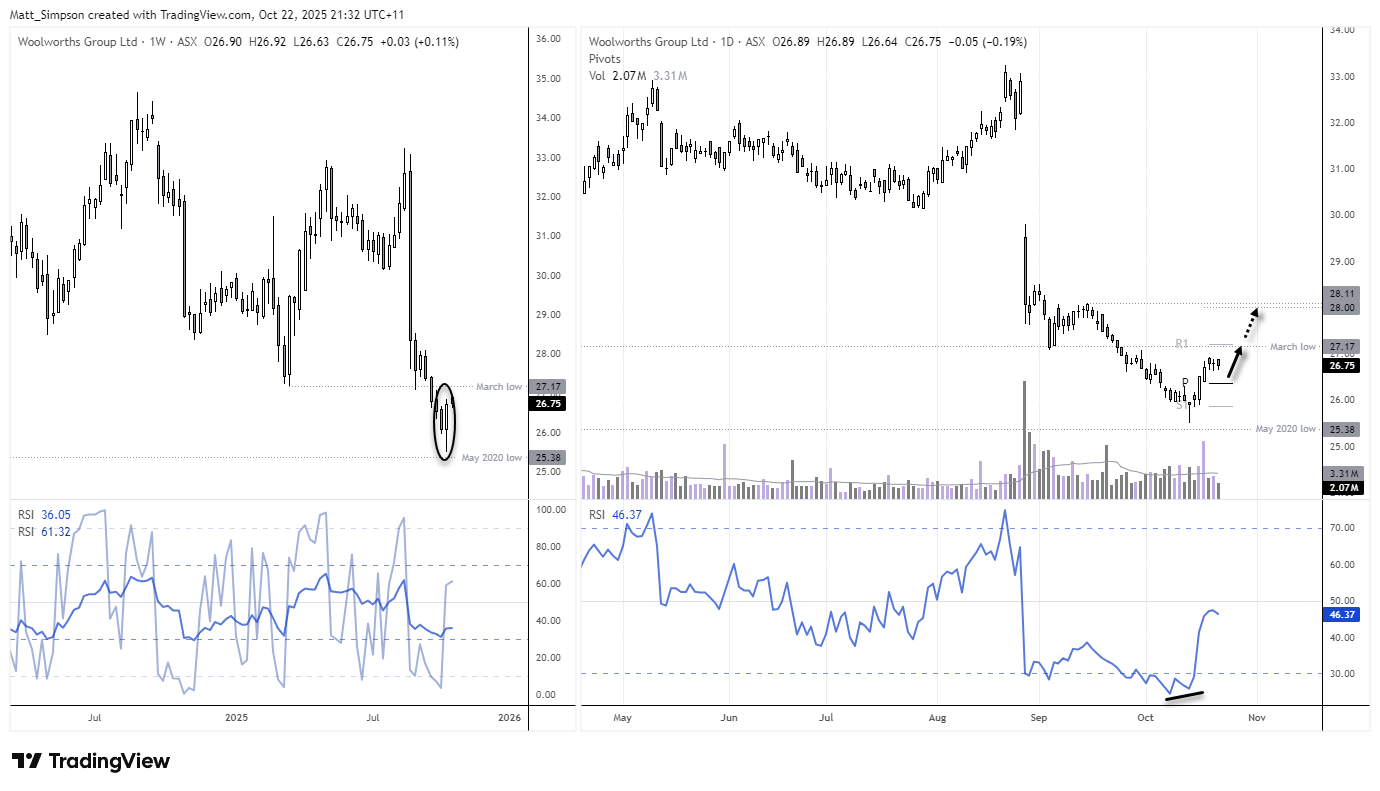
Chart analysis by Matt Simpson - source: Tradingview
View the full economic calendar
-- Written by Matt Simpson
Follow Matt on Twitter @cLeverEdge
How to trade with City Index
You can trade with City Index by following these four easy steps:
- Open an account, or log in if you’re already a customer
• Open an account in the UK
• Open an account in Australia
• Open an account in Singapore
- Search for the market you want to trade in our award-winning platform
- Choose your position and size, and your stop and limit levels
- Place the trade


