


The ASX 200 followed Wall Street’s mild risk-on lead, gaining 0.3% as commodities rebounded and Materials led the advance. Energy stocks also firmed, while Financials and Tech lagged as traders weighed inflation pressures against sector rotation prospects.
View related analysis:
- ASX 200 Morning Outlook: Buyers Test Support as BHP and WOW Stabilise
- ASX 200 Morning Outlook: Real Estate Reeling Post RBA (GMG, GPT, SCG)
- ASX 200 Morning Market Outlook: Bearish Reversal Pattern For October
- ASX 200 Morning Market Outlook: Sectors Highlight Structural Weakness
Commodities Rebound Lifts Materials and Energy Sectors
ASX 200 Market Snapshot
- The mild risk-on bounce enjoyed by Wall Street on Wednesday was mirrored by the ASX 200 on Thursday, with the index rising a modest 0.3%.
- Seven of the eleven ASX 200 sectors advanced, led by Materials (XMJ) and Energy (XEJ), while Consumer Discretionary (XDJ) and Information Technology (XIJ) lagged.
- Daily trading volume hovered around its 20-day average for a second session and marked a four-day high.
- However, the rebound was not convincing enough to declare a cycle low in the correction from record highs. A break below the September low at 8738.8 would confirm a potential resumption of the broader bearish move.
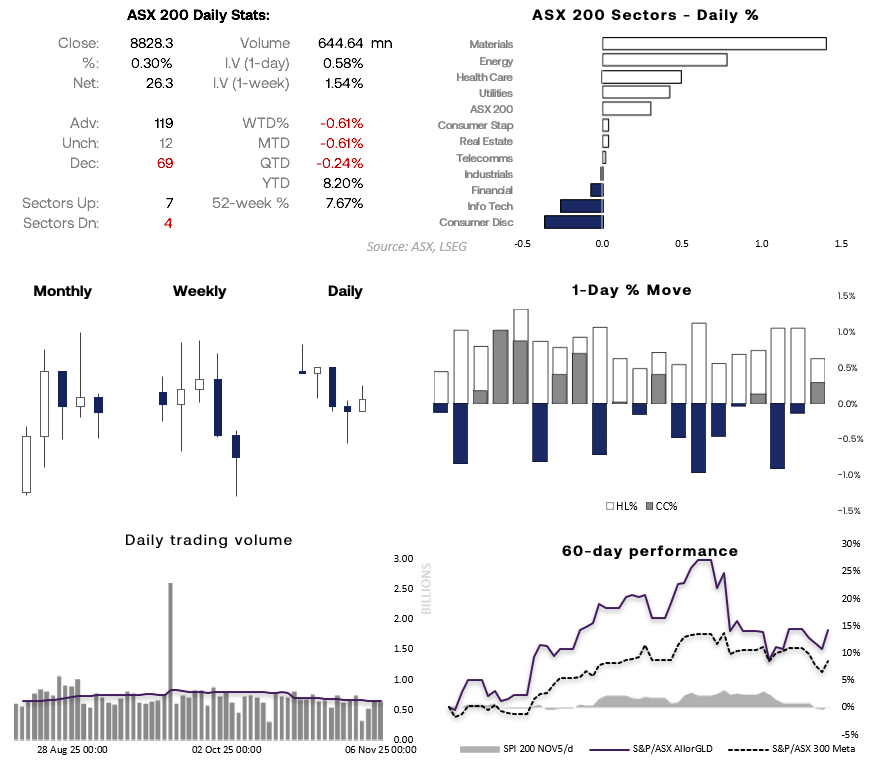
Chart analysis by Matt Simpson - source: ASX, LSEG

Commodities Bounce Supports ASX Gold, Resources, Metals and Mining Sectors
A slight lift in risk appetite on Wednesday supported commodities, with gold, silver, copper, and crude oil all posting modest gains.
This helped the ASX All Ordinaries Gold Index (XGD) snap a three-day losing streak and rebound from its 50-day average. With a potential double bottom forming around 15,000, gold stocks may have further upside potential near term.
The ASX Metals & Mining Index (XMM) also bounced from its 50-day EMA after its daily RSI (2) hit its most oversold level since September 10. Given its underlying bullish structure, the sector may be near a corrective low.
The ASX 200 Resources Index (XJR) shows a similar rebound pattern. With tech and consumer discretionary sectors underperforming amid hotter-than-expected Australian inflation, commodities could continue to lead as part of a reflation-driven rotation within the ASX 200.
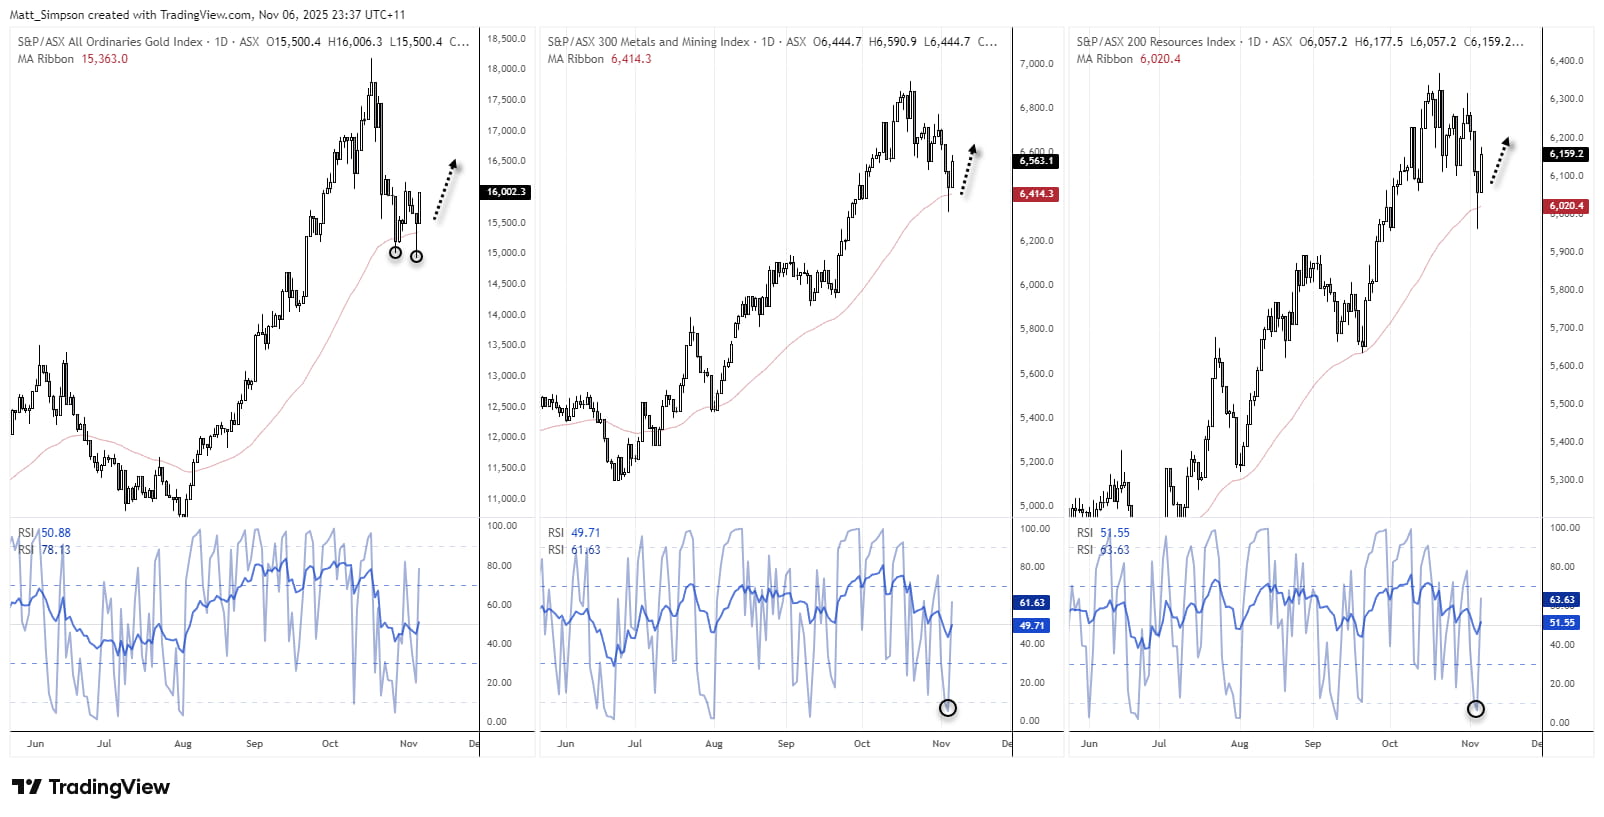
Chart analysis by Matt Simpson - source: ASX, LSEG

ASX 200 Correlations
While the Financials and Materials sectors account for roughly half of the ASX 200’s market capitalisation, their correlations with the broader index have diverged sharply. Financials currently show little to no correlation — even turning inversely related over the past 10 days — whereas Materials continue to track (and possibly drive) the index across the 10-, 20-, and 60-day periods.
Risk sentiment is also evident, with the ASX 200 maintaining positive correlations with Wall Street benchmarks (S&P 500, Nasdaq 100) and AUD/USD, underscoring the global risk-on dynamic influencing Australian equities.
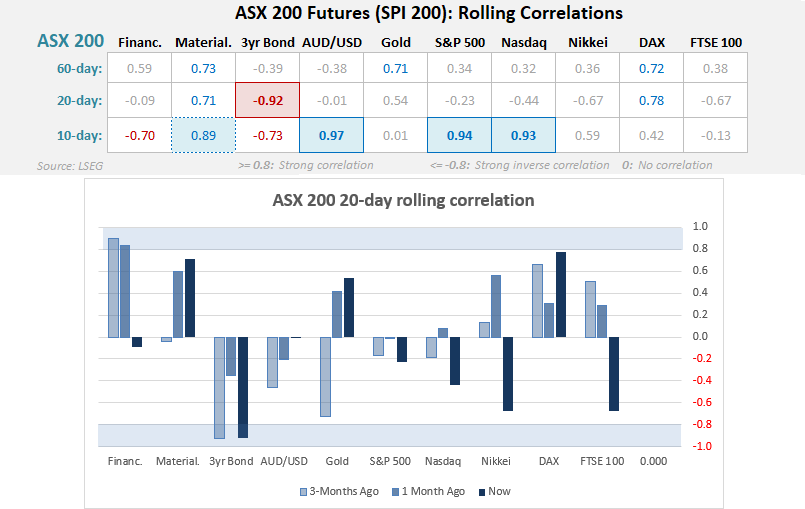
Chart analysis by Matt Simpson - source: ASX, LSEG
View the full economic calendar
-- Written by Matt Simpson
Follow Matt on Twitter @cLeverEdge
How to trade with City Index
You can trade with City Index by following these four easy steps:
- Open an account, or log in if you’re already a customer
• Open an account in the UK
• Open an account in Australia
• Open an account in Singapore
- Search for the market you want to trade in our award-winning platform
- Choose your position and size, and your stop and limit levels
- Place the trade


