


The ASX 200 begins October on a constructive note, with seasonal trends pointing to a bullish bias and elevated volatility. Historically, October delivers one of the strongest median returns of the year while also being the most volatile month on record. Technical signals and sector rotation suggest a potential cycle low has been set, giving traders reasons to watch for further upside.
View related analysis:
- ASX 200 Morning Market Outlook: ASX Snaps 5-Month Winning Streak
- ASX 200 Outlook: RBA to Stay Cautious After Softer Employment Report
- ASX 200 and Nikkei 225 Analysis: Technicals and COT Outlook
ASX 200 October Outlook: Bullish and Volatile
ASX 200 Market Snapshot
- The ASX 200 edged lower on Wednesday, but a bullish hammer above the 50-day EMA and a close back above the 20-day EMA point to potential near-term support.
- 8 of 11 sectors advanced, led by Industrials and Telecoms, while declines were concentrated in Consumer Discretionary and Materials.
- Industrials gained 1%, marking their strongest single-day performance in a month, adding weight to the case that an important cycle low was set last week.
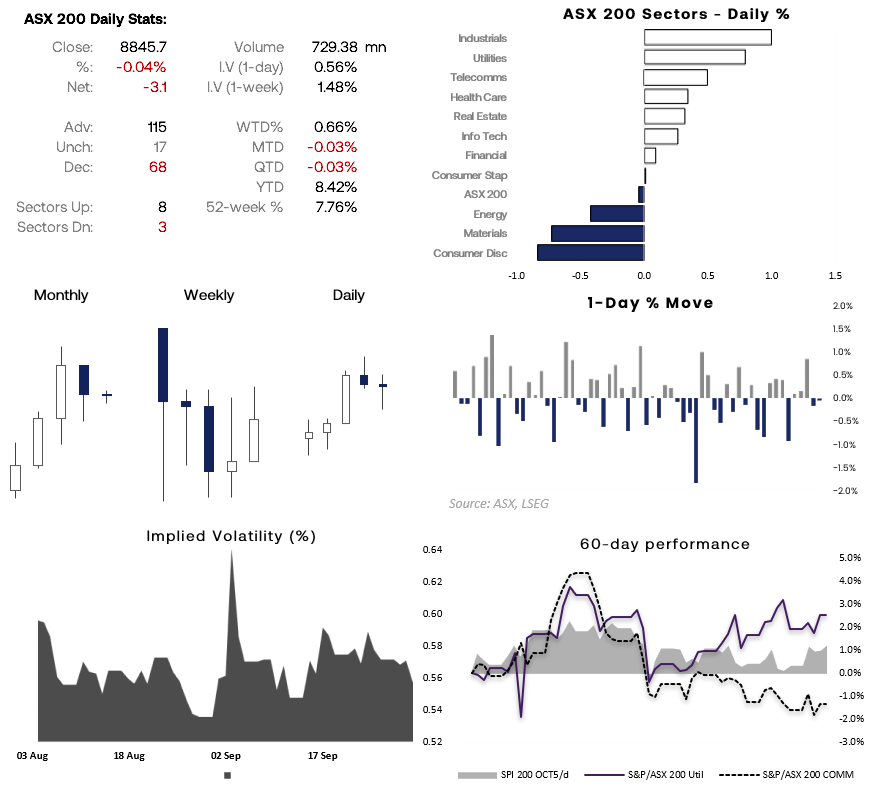
Chart analysis by Matt Simpson - data source: ASX, LSEG
ASX 200 Seasonality Analysis
ASX 200 Seasonality for October
- Over the past 33 years, October has averaged the most volatile monthly range at 7.2%, making it a key month for traders.
- The average return of 0.65% comes with a 60.6% win rate, showing a consistent bullish bias.
- October’s median return of 2% ranks as the second-strongest month of the year, just behind April’s 2.4%.
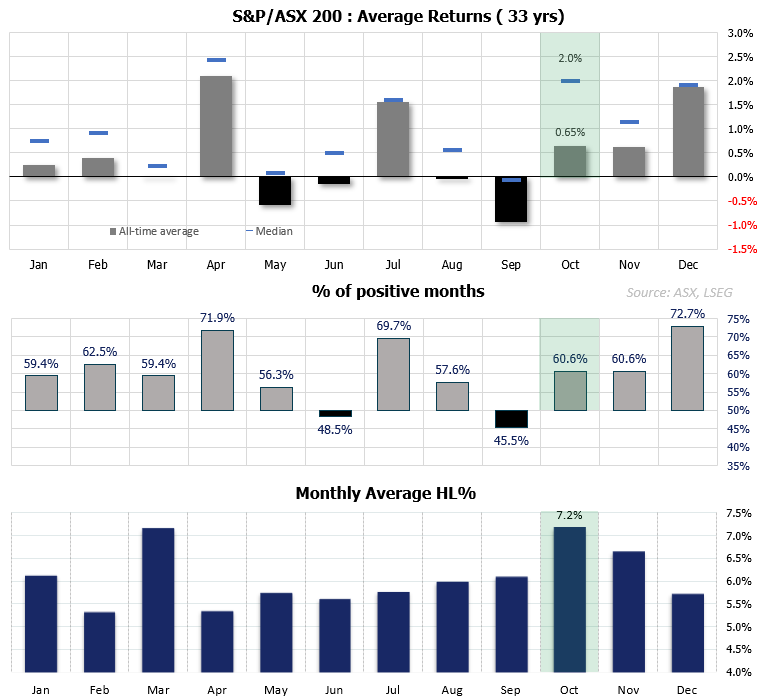
Chart prepared by Matt Simpson - Source: ASX, LSEG

ASX 200 Daily Seasonality in October
- For much of October, ASX 200 daily returns appear sporadic, with no consistent pattern early in the month.
- A clearer trend emerges into month-end, with a bearish phase from 26–29 October, where average returns are negative and win rates drop below 50% on three of those days.
- The final two sessions of the month typically flip bullish, with positive average returns and win rates above 50%.
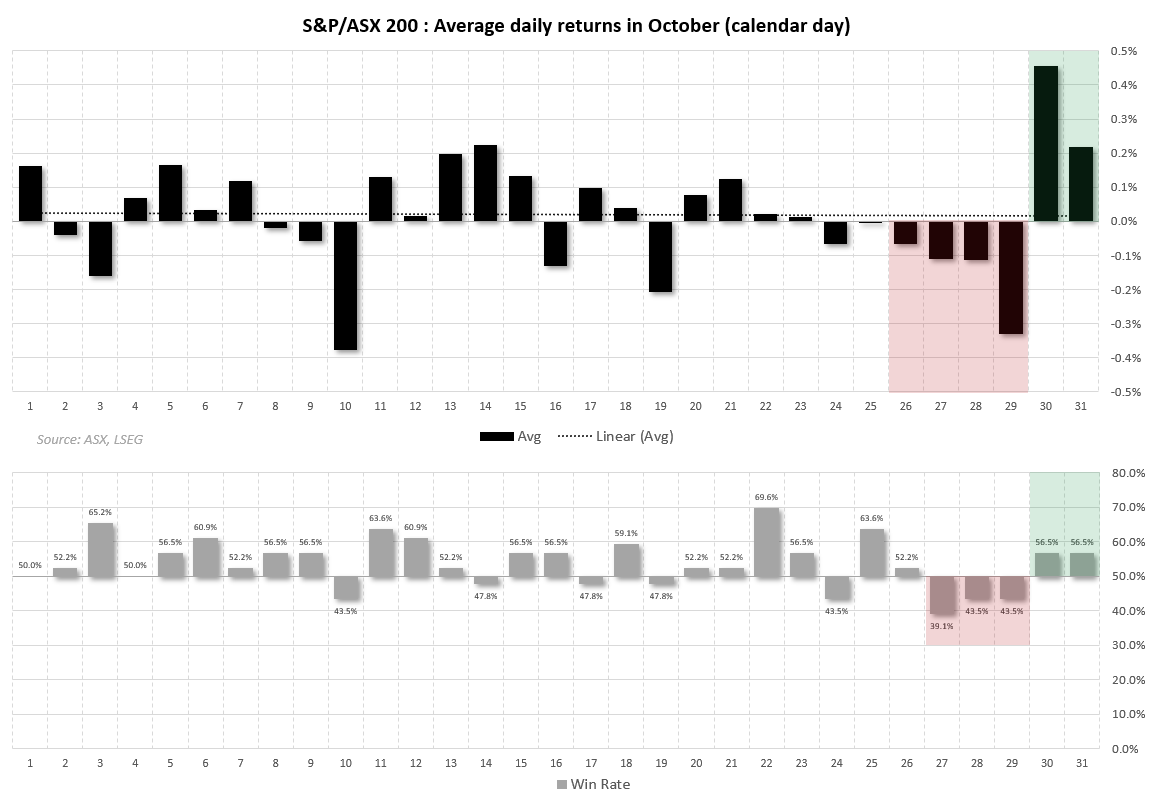
Chart prepared by Matt Simpson - Source: ASX, LSEG
ASX 200 Technical Analysis
The ASX 200 is edging towards a bullish breakout, with a brief two-day pullback holding firm above the 50-day EMA. Prices are now testing the September highs, and a breakout above this level would place the monthly R1 pivot just below the 9,000 handle into focus — bringing the index within striking distance of fresh record highs.

Chart analysis by Matt Simpson - Source: TradingView, ASX SPI 200 Index Futures
View the full economic calendar
-- Written by Matt Simpson
Follow Matt on Twitter @cLeverEdge
How to trade with City Index
You can trade with City Index by following these four easy steps:
- Open an account, or log in if you’re already a customer
• Open an account in the UK
• Open an account in Australia
• Open an account in Singapore
- Search for the market you want to trade in our award-winning platform
- Choose your position and size, and your stop and limit levels
- Place the trade


