


The ASX 200 snapped a three-week winning streak after forming a bearish engulfing week just beneath its record high. Rising oil prices, higher bond yields and shifting global equity sentiment have begun to weigh on risk appetite. While the pullback raises the risk of a deeper retracement, key support levels remain nearby and could determine whether the index stabilises or extends its decline.
View related analysis:
- ASX 200 Outlook: 9,000 Reclaim the Key After Volatility Spike
- ASX 200 Market Outlook: 9200 Caps Gains Amid Geopolitical Risk
- ASX 200 Market Outlook: WOW Rallies, CBA Stalls as 9,200 Caps Gains
- ASX 200 Market Outlook: Record High Faces Key Options Pivot
Oil, Bond Yields and Global Equities Drive ASX 200 Market Risk
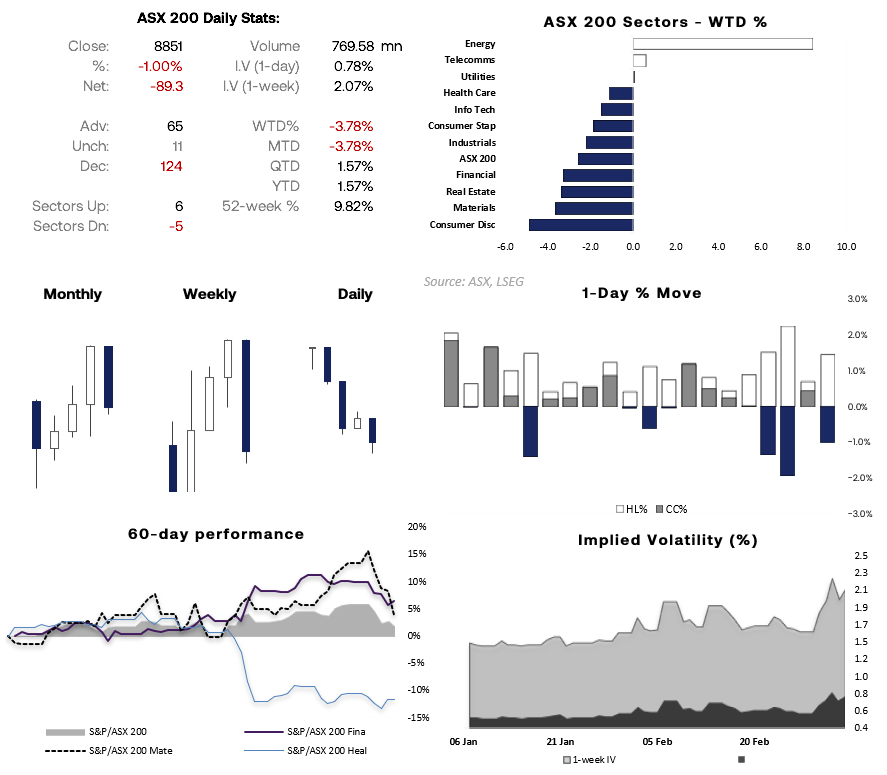
ASX 200 Market Snapshot
- The ASX 200 snapped a 3-week winning streak with a bearish engulfing candle and worst week since late March
- 5 of the 11 ASX sectors declined, led by materials (XMJ) while information technology (XIJ) led the 6 ASX sectors higher
- Implied volatility remains elevated at 2% for the next week, though down from Monday’s high
- Woodside Energy (WDS) closed above 30 for the first time this year, closing just -5.5% from its record high
- Wesfarmers (WES) fell for a third week, down -13.8% since its earnings report
- Woolworths (WOW) rose to a 2.5-year high, and now sits just -2% from its record high
Source: ASX, LSEG
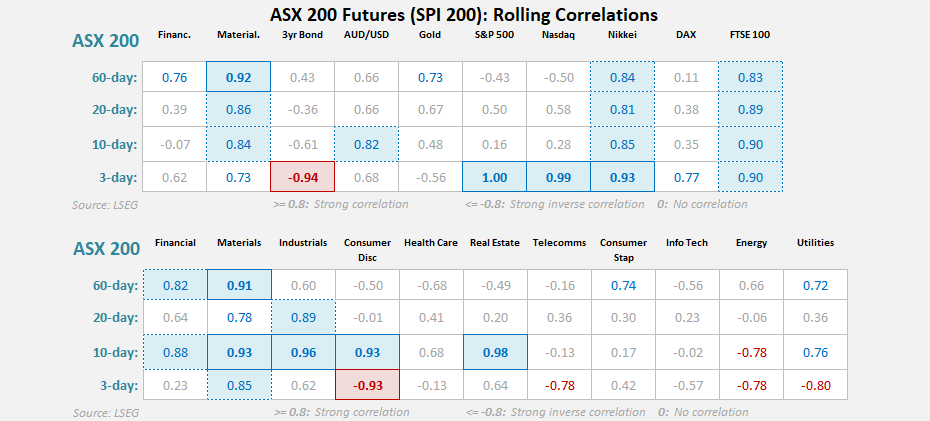
Global Equities and Materials Continue to Drive the ASX 200
The ASX 200 remains most closely tied to materials and global equity markets, reflecting its commodity-heavy structure. Longer-term correlations show strong alignment with materials, financials, the Nikkei and FTSE 100, highlighting how the Australian market tends to move with global risk sentiment.
Short-term data shows US equities are currently driving the index, with the 3-day correlation near 1.0 with the S&P 500 and Nasdaq. At the same time, the ASX 200 has moved inversely with bond yields, indicating rising yields have recently pressured equities.
Sector correlations confirm materials, industrials and financials remain the key drivers of the index, while some defensive and consumer sectors have recently diverged.
Source: ASX, LSEG

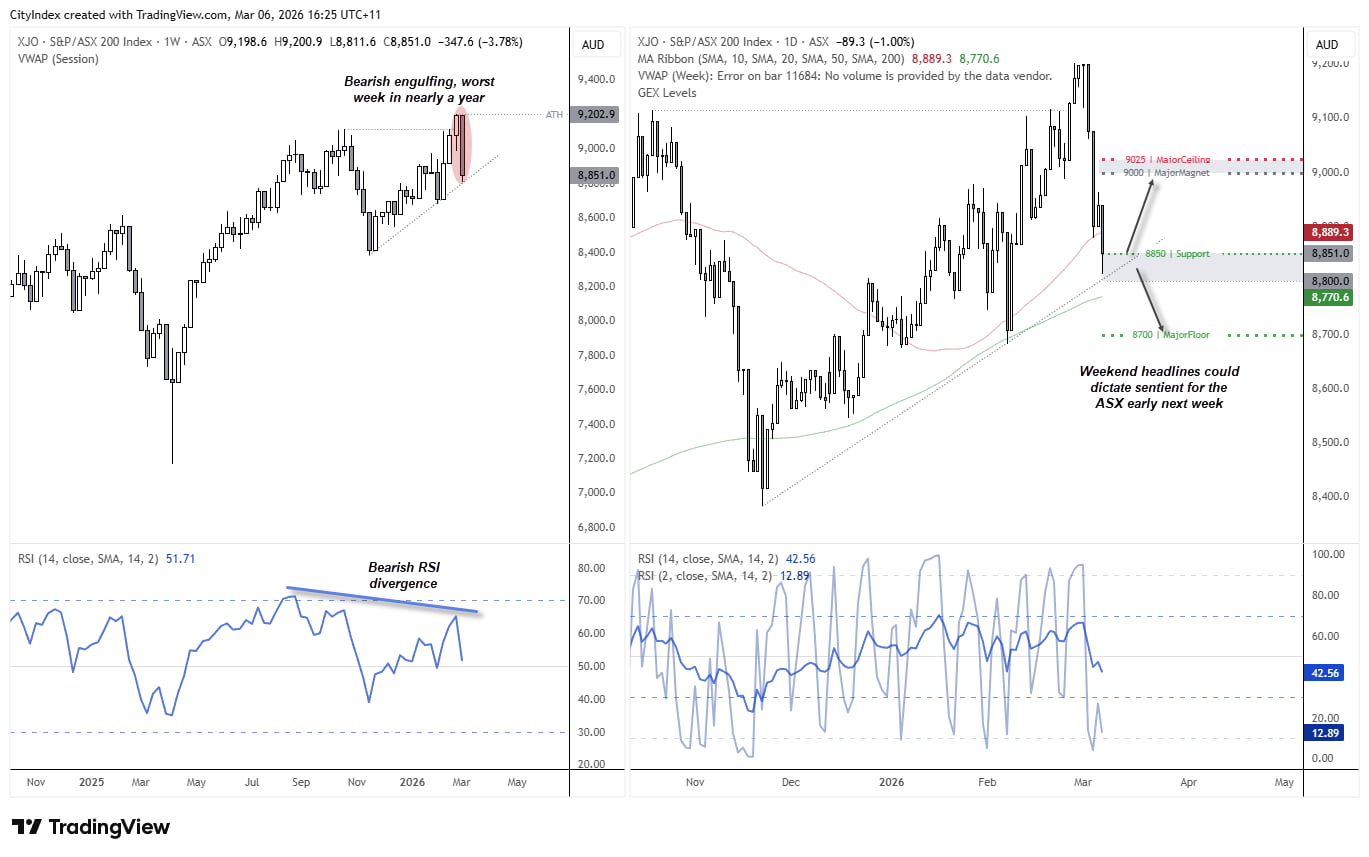
ASX 200 Technical Analysis
The weekly chart (left) shows a prominent bearish engulfing week just beneath the all-time high set the week prior. Its -3.8% decline marks the worst week since late March, and with a long-term bearish divergence forming on the RSI (14), it raises the question of whether a more meaningful top may be forming.
The combination of war in the Middle East, higher oil prices and an already hawkish RBA appears to have finally taken its toll on ASX investors.
The daily chart shows Friday also formed a bearish engulfing day, although its high-to-low range was smaller than the sharp selloffs seen on Tuesday and Wednesday. Volatility remains elevated relative to calmer periods. Friday’s low did not quite test trend support, but it was close enough to suggest traders are watching it closely.
Price also closed just above the 8,850 options cluster, which may provide near-term support. If markets receive more positive headlines from the Middle East on Monday, the ASX could be treated to a decent bounce from these levels. However, with options clusters sitting around 9,000 and 9,025, the next resistance zone appears clearly defined.
8,800, 8,870.6 (200-day SMA), and 8,700 become key support levels if bears retain control next week.
Source: ASX, TradingView
View the full economic calendar
-- Written by Matt Simpson
Follow Matt on Twitter @cLeverEdge
How to trade with City Index
You can trade with City Index by following these four easy steps:
- Open an account, or log in if you’re already a customer
• Open an account in the UK
• Open an account in Australia
• Open an account in Singapore
- Search for the market you want to trade in our award-winning platform
- Choose your position and size, and your stop and limit levels
- Place the trade


