


The ASX 200 is showing signs of strain as softer Australian employment figures weigh on sentiment. Headline jobs growth contracted again, full-time positions saw their sharpest fall in months, and the participation rate continued to decline. These signals reinforce the Reserve Bank of Australia’s cautious tone on the outlook. At the same time, technical charts suggest the ASX 200 may have entered a corrective phase after its run to 9,000, with momentum pointing to deeper pullback risks.
View related analysis:
- ASX 200 and Nikkei 225 Analysis: Technicals and COT Outlook
- ASX 200 and Nikkei 225 Technical Outlook: Reversals and Key Levels in Focus
- ASX 200 Outlook: Futures Signal Bearish Correction After 9000 Rejection
- US Dollar Reverses Post-Fed: AUD/USD, GBP/AUD in Focus for AU Jobs, UK CPI
Cracks Widen in Australian Employment Figures
Bets on Reserve Bank of Australia (RBA) rate cuts have eased in recent weeks, yet today’s labour force report shows further signs of weakness. Headline employment fell by 5.4k in August, marking the second contraction in six months. More concerning was the 40.9k decline in full-time jobs — the sharpest monthly fall in six months and the second steepest since December 2023.
The participation rate slipped for a second consecutive month, and has now fallen in five of the past seven months. While the unemployment rate held steady at 4.2% (seasonally adjusted), it has been trending higher since late 2022.
These figures are unlikely to trigger immediate easing from the RBA, but they reinforce the central bank’s cautious tone. The AUD/USD dipped around 20 pips on the release, three-year yields fell 4.6 basis points, and the ASX ticked slightly higher — though still trades down 0.5% post-Fed. Price action suggests further downside risks remain.
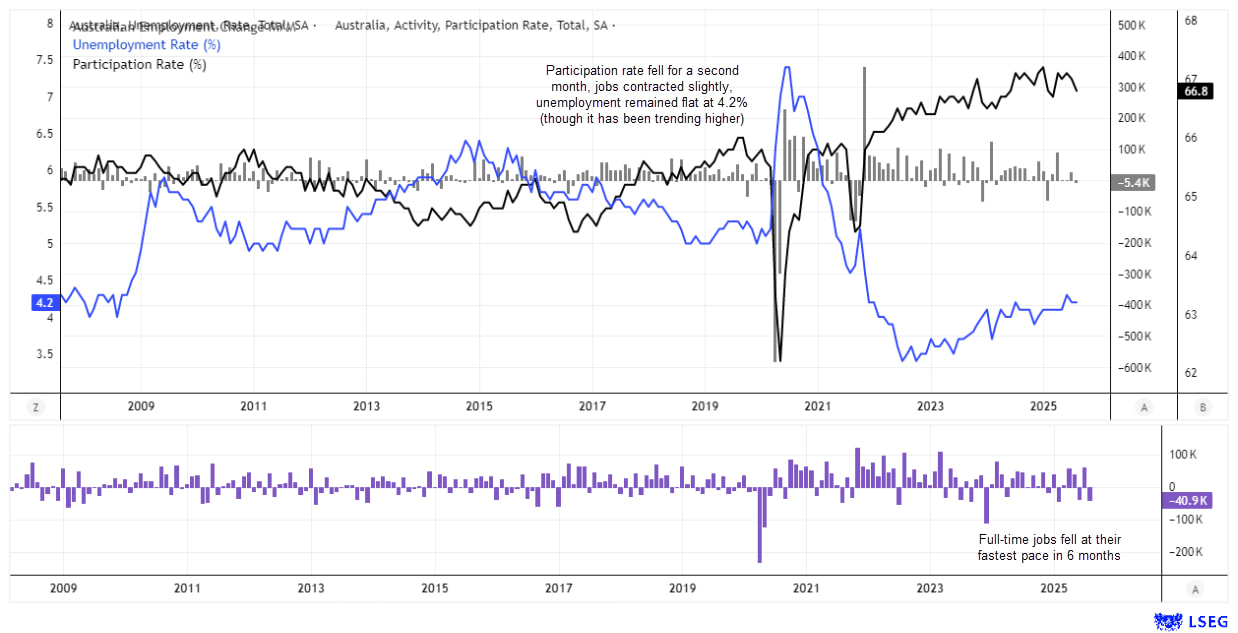
Chart prepared by Matt Simpson. Data source: Australian Bureau of Statistics (ABS), LSEG.
ASX 200 Futures (SPI 200) Technical Analysis: Monthly, Weekly Chart
I had cautioned that a retracement on the ASX 200 was likely after its push to the 9,000 level. And one is already underway, as the ASX 200 looks set to end its five-month winning streak – its strongest run since March 2024.
On the monthly chart, the RSI (2) has reached its most overbought reading since March 2024, while bearish divergences are evident on both the RSI (2) and RSI (14).
On the weekly timeframe, a pullback towards the February high at 8663, which aligns with the 20-week SMA, appears feasible without undermining the broader bullish trend. That said, the weekly RSI (2) is now in oversold territory, meaning bears may be better off fading into minor rallies rather than risking being caught short at an interim cycle low.
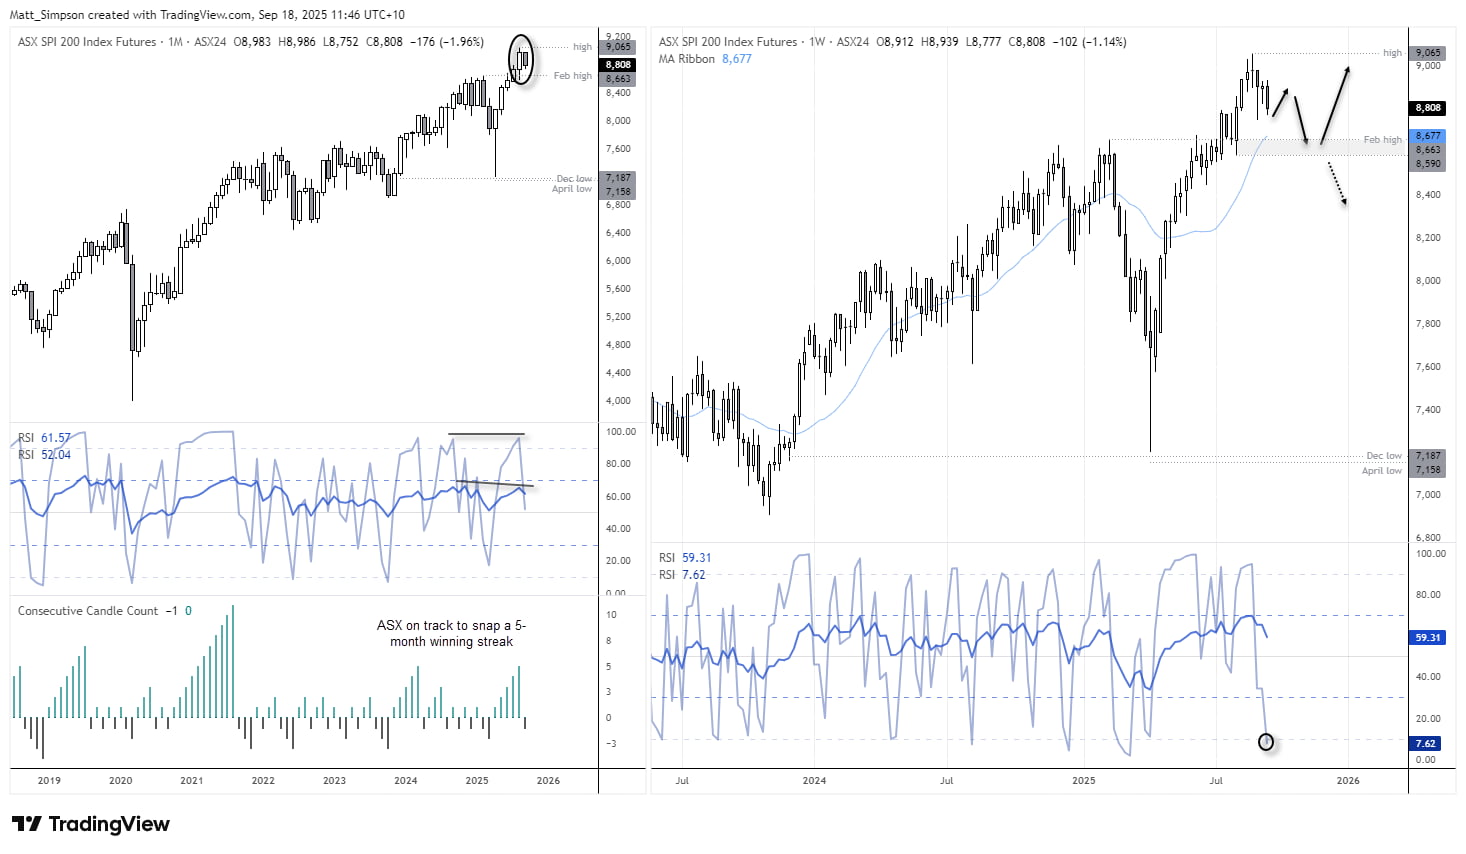
Chart analysis by Matt Simpson, Source: TradingView, Australian Stock Exchange, ASX SPI 200 Index Futures (AP1!)

ASX 200 Performance
Ten of the eleven ASX 200 sectors are in the red for September, led by energy and health care. While the index remains up 7.5% year-to-date (YTD), it has already handed back more than 2.2% since its record high less than three weeks ago. The daily % move chart also shows bullish days losing momentum while bearish sessions are becoming more frequent and pronounced. This suggests the ASX 200 may extend lower before a corrective low is found, although the path is unlikely to be a straight line, with minor rebounds expected along the way.

Chart analysis by Matt Simpson, Source: Australian Stock Exchange, LSEG
ASX 200 Futures (SPI 200) Technical Analysis: Daily Chart
The weekly chart shows a 3-wave move from the 9,000 area. But that fact that bearish momentum accelerated to the 61.8% Fibonacci ratio suggests bears may not be done yet. Furthermore, momentum has seen ASX prices break out of a bearish continuation pattern and also the 50-day SMA.
A 100% projection of the initial 3-wave decline projected from the corrective high sits at 8625, though bears could use the February high (8663) as a more conservative target. Should a broad-scale risk-off move unfold, note the 161.8% projection sits right near the 200-day SMA (8436).

Chart analysis by Matt Simpson, Source: TradingView, Australian Stock Exchange, ASX SPI 200 Index Futures (AP1!)
View the full economic calendar
-- Written by Matt Simpson
Follow Matt on Twitter @cLeverEdge
How to trade with City Index
You can trade with City Index by following these four easy steps:
- Open an account, or log in if you’re already a customer
• Open an account in the UK
• Open an account in Australia
• Open an account in Singapore
- Search for the market you want to trade in our award-winning platform
- Choose your position and size, and your stop and limit levels
- Place the trade


