
The S&P/ASX 200 Index (ASX 200) has staged an impressive rally since its April low, rising nearly 20% in under three months. But the momentum that fuelled the Australia 200 to multi-month highs now appears to be fading, as bearish signals emerge near key resistance. As we enter the second half of July, historical seasonality remains in favour of the bulls—but the technicals suggest caution may be warranted.
View related analysis:
- Nasdaq 100, S&P 500: Seasonality Analysis For July
- AUD/USD H2 Outlook: Can the Australian Dollar Keep Rebounding?
- EUR/AUD Reversal Risk Builds as Bearish Momentum Aligns With Historical Tops
- US Dollar Index Climbs for 10th Day as Inflation Data Undermines Fed Cuts
S&P ASX 200 Cash (Australia 200) Technical Analysis:
While the S&P/ASX 200 Index is currently holding above the 20-day EMA, buyers are struggling to push the index beyond the February high. This has allowed a bearish divergence to build on the daily RSI. More concerning is the bearish engulfing candle that formed on Wednesday, just below the all-time high (ATH). The fact that this 2-bar reversal pattern formed around key resistance suggests growing selling pressure, and raises the risk of a counter-trend move developing from these levels.

Chart analysis by Matt Simpson - Source: TradingView, S&P/ASX 200 Index

ASX 200 (Australia 200) Seasonality – July Trends
While short-term price action suggests the potential for a pullback, it's worth noting that July is historically a strong month for the ASX 200. Over the past 33 years, the S&P/ASX 200 Index has delivered an average return of 1.56%, with gains in 69.7% of July sessions.
Drilling into the numbers, the average gain in a positive July is +3.4%, while the average decline during negative Julys is -2.8%, skewing the seasonal bias in favour of bullish outcomes. That said, seasonality is never guaranteed—macro fundamentals and risk sentiment can easily override historical averages.
So far, the ASX 200 has only gained 0.23% in the first half of July, meaning bulls will need strong follow-through in the second half of the month to meet the seasonal norm. But if the index stumbles, this historical tailwind may still offer technical support, unless a broader risk-off environment emerges.
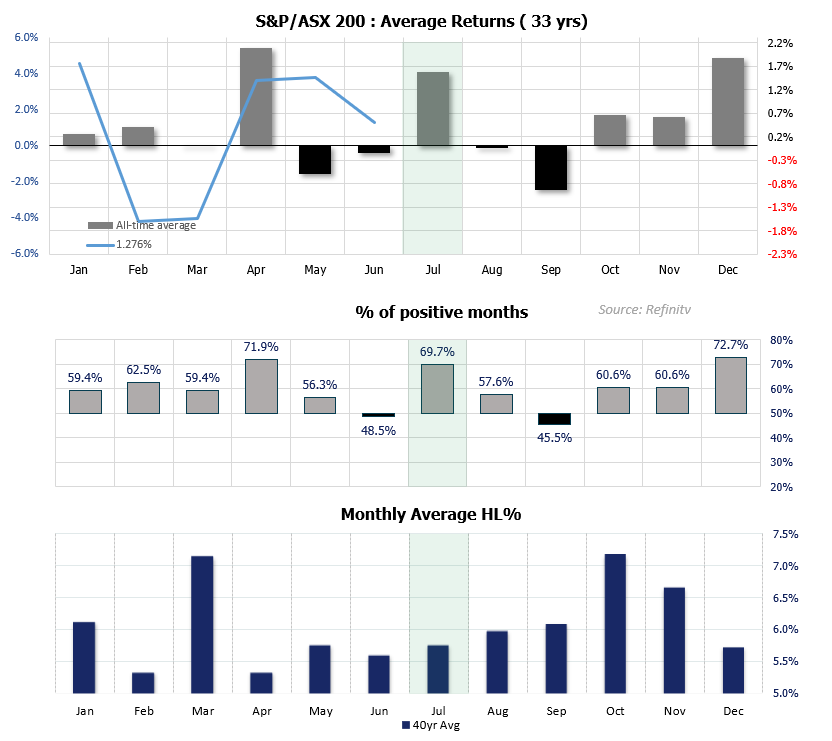
Chart prepared by Matt Simpson - Source: London Stock Exchange Group (LSEG), Australian Securities Exchange (ASX)
S&P ASX 200 Futures (SPI 200) Technical Analysis:
Wall Street futures were marginally higher overnight after President Trump walked back comments suggesting he might fire Federal Reserve Chair Jerome Powell. The Dow Jones futures—which tend to have the strongest correlation with the ASX 200—rose 0.4%, while the S&P 500 and Nasdaq 100 gained 0.2% and 0.1% respectively.
In response, SPI 200 futures are up 0.6% from yesterday’s low, suggesting a positive start for today’s ASX 200 cash market. However, prices are now trading around a notable resistance cluster that includes the December high (8,588), the February high (8,616), and the all-time high (8,636). This could limit further upside without a broader catalyst for risk-on sentiment.\
The 1-hour chart shows strong bullish momentum, but unless bulls are fuelled by fresh stock market optimism, sellers may look to fade into rallies toward these resistance zones. Initial downside targets include the high-volume node (HVN) at 8,536, followed by the 8,512 swing low and the 8,500 psychological handle. A break beneath these levels could signal the start of a deeper retracement.
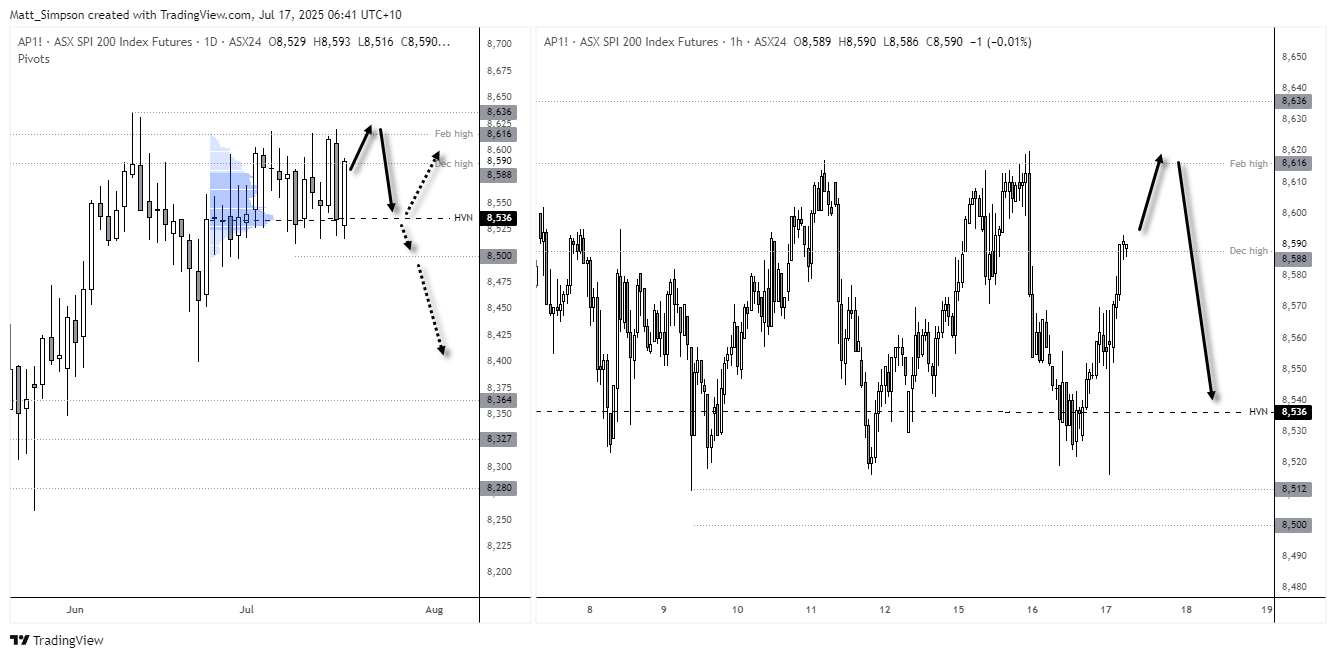
Chart analysis by Matt Simpson - Source: TradingView, ASX SPI 200 Index Futures
Economic Events in Focus (AEST / GMT+10)
08:45 NZD FPI (Jun) (NZD/USD, NZD/JPY, AUD/NZD)
09:50 JPY Trade Balance, Exports, Imports, Foreign Bonds & Stock Investment (Jun) (USD/JPY, AUD/JPY, EUR/JPY, Nikkei 225)
11:00 AUD MI Inflation Expectations (Jul) (AUD/USD, AUD/NZD, AUD/JPY, ASX 200)
11:30 AUD Employment Data, Unemployment Rate, NAB Quarterly Confidence (Jun) (AUD/USD, AUD/NZD, AUD/JPY, ASX 200)
16:00 GBP UK Employment, Wages, Unemployment Rate (May) (GBP/USD, GBP/JPY, GBP/CHF, EUR/GBP, FTSE 100)
16:00 CHF Trade Balance (Jun) (USD/CHF, CHF/JPY, EUR/CHF, GBP/CHF)
19:00 EUR CPI, Core CPI, HICP (Jun) (EUR/USD, DAX)
22:30 USD Jobless Claims, Retail Sales, Import/Export Prices, Philly Fed (Jun/Jul) (USD, S&P 500, Nasdaq 100, Dow Jones, Gold, Crude Oil)
22:30 CAD Foreign Securities Purchases (May) (USD/CAD, TSX)
00:00 USD Business Inventories, NAHB Housing Index, Retail Inventories (May/Jul) (USD, S&P 500)
00:00 USD FOMC Member Kugler Speaks (USD/JPY, EUR/USD, GBP/USD, AUD/USD, US indices)
00:30 USD Natural Gas Storage (Crude Oil, Natural Gas Futures)
02:45 USD FOMC Member Daly Speaks (USD/JPY, EUR/USD, GBP/USD, AUD/USD, US indices)
03:00 USD Atlanta Fed GDPNow (Q2) (USD, S&P 500, Gold, Crude oil)
View the full economic calendar
-- Written by Matt Simpson
Follow Matt on Twitter @cLeverEdge
How to trade with City Index
You can trade with City Index by following these four easy steps:
- Open an account, or log in if you’re already a customer
• Open an account in the UK
• Open an account in Australia
• Open an account in Singapore
- Search for the market you want to trade in our award-winning platform
- Choose your position and size, and your stop and limit levels
- Place the trade