
AUD/JPY is holding near key support after Australia’s July jobs report delivered a strong rebound in full-time employment, easing fears of a labour market slowdown. Unemployment fell to 4.1% from 4.2%, with 60.5k full-time jobs added — the fastest monthly rise since February — reversing June’s steep decline. The upbeat data, alongside steady wage growth, has tempered expectations for a September Reserve Bank of Australia rate cut, helping keep the Australian dollar supported against the Japanese yen.
View related analysis:
- US Dollar Probes Trend Support Ahead of PPI, AUD/USD in Focus for Jobs
- AUD/USD Softens, ASX Hits Record as RBA Cuts and Lowers Cash Rate Projection
- AUD/USD Weekly Outlook: Fed Bets Boost Aussie as US Data Weakens
Australian Jobs Rebound Supports AUD/JPY at Key Level
Any concern that the Australian employment figures would continue deteriorate were brushed aside with the release of today’s report. Unemployment retreated by -0.1 percentage points to 4.1% and 24.4k jobs were added. Though it was the surge of 60.5k full-time jobs which will likely hog headlines, as it was the fastest month-over-month rise since February, and more than erases the -38.2k decline in June. A separate shows that average weekly earnings rose 4.5% y/y in May in seasonally adjusted terms.
It seemed unlikely that the RBA would rush into another cut in September before the employment figures. And with wages rising above expectations at 3.4% y/y and 0.8% q/q, they have even less reason to rush now.
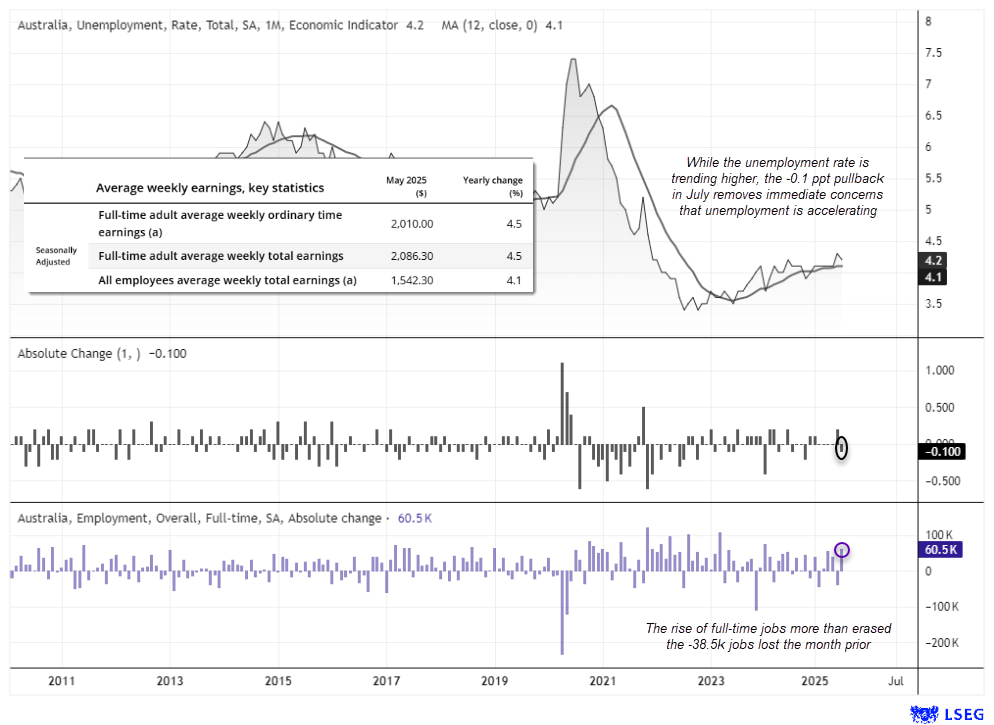
Chart prepared by Matt Simpson - data source: Bureau of Labor Statistics (LBS), London Stock Exchange Group (LSEG)
AUD/JPY Technical Analysis: Australian Dollar vs Japanese Yen
The Australian dollar has maintained a strong uptrend against the Japanese yen, with AUD/JPY climbing more than 13% from the April low to the July high. A bearish engulfing week at the February high signalled the risk of a deeper correction, but buyers stepped in as a bullish engulfing week formed at the 20-week EMA. The 10-week EMA continues to point higher, with AUD/JPY trading comfortably above it.
Price action on the daily chart is also offering bullish clues. AUD/JPY advanced for six consecutive days, and its current two-day retracement remains shallow by comparison. I’m not convinced we’ll see a move back to the 94.50 high-volume node (HVN) without a fresh catalyst or a bout of risk-off sentiment.
Prices are attempting to hold above the 96 handle, which aligns with the weekly and monthly pivot points. Given the bullish technical signals stacking up — alongside Wall Street indices at record highs, the Bank of Japan in no rush to hike rates, and the Reserve Bank of Australia in no hurry to cut — dips beneath 96 still seem more likely to attract buyers than not.
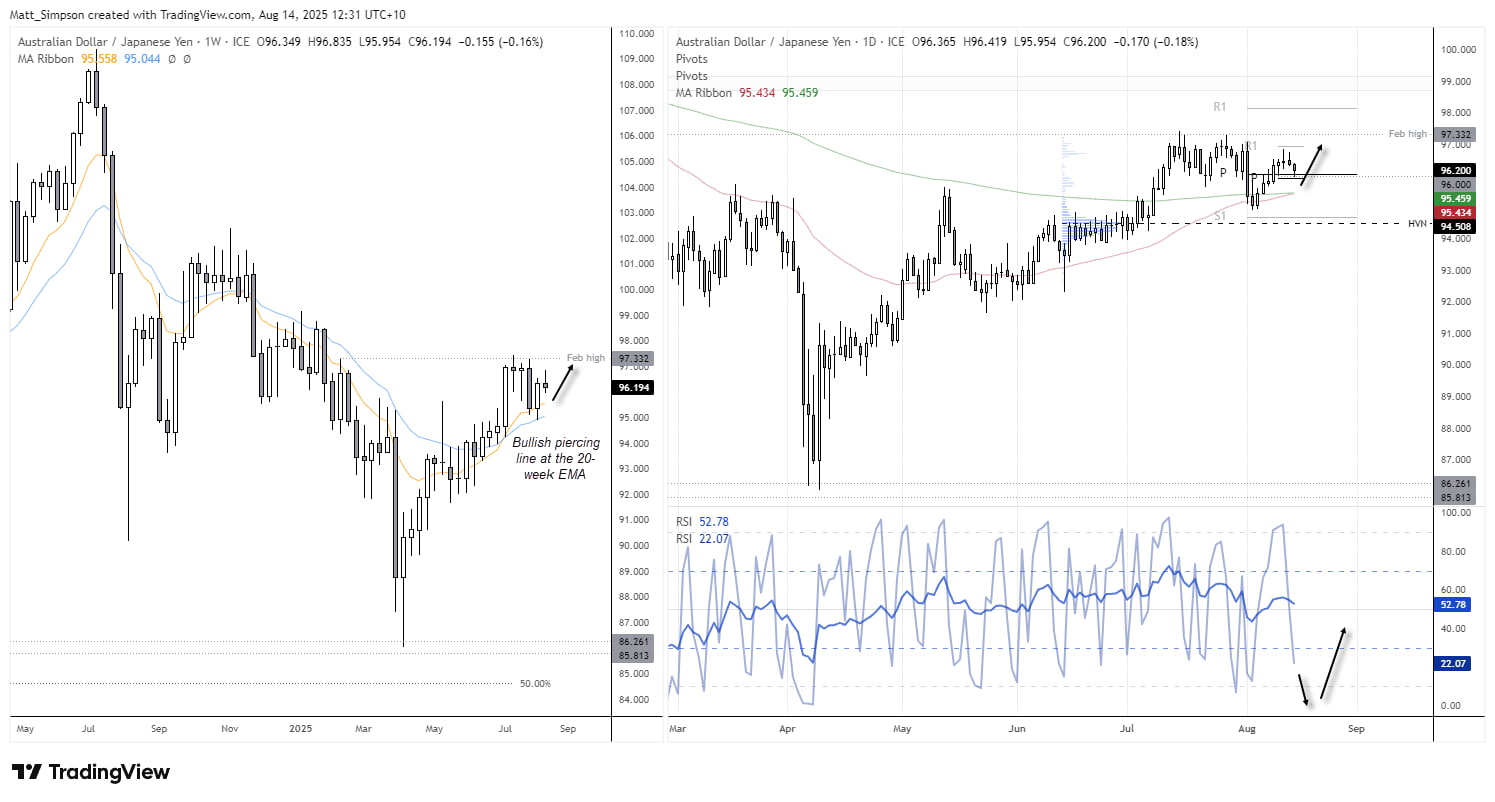
Chart analysis by Matt Simpson - data source: TradingView AUD/JPY
AUD/JPY Technical Analysis: Intraday Chart
The 4-hour chart suggests a potential rounding top pattern may be forming on AUD/JPY. However, the 200-bar EMA and nearby high-volume node (HVN) around 95.82 could act as immediate support. Should prices dip below this area, a rebound back above 95.80 could signal a swing low while the pair holds above the weekly S1 pivot at 95.33.

Chart analysis by Matt Simpson - data source: TradingView AUD/JPY
View the full economic calendar
-- Written by Matt Simpson
Follow Matt on Twitter @cLeverEdge
How to trade with City Index
You can trade with City Index by following these four easy steps:
- Open an account, or log in if you’re already a customer
• Open an account in the UK
• Open an account in Australia
• Open an account in Singapore
- Search for the market you want to trade in our award-winning platform
- Choose your position and size, and your stop and limit levels
- Place the trade