


The Australian dollar has posted its longest winning streak against the Japanese yen in a decade, rising for 10 consecutive sessions. The move has been fuelled by resilient Australian macro data and a less dovish Reserve Bank of Australia, in contrast to the Bank of Japan’s firmly dovish tone. Household spending and inflation data continue to support a steady RBA, but with AUD/JPY now testing resistance, traders may be eyeing a potential pullback — or a breakout, if momentum holds.
View related analysis:
- AUD/USD Creeps Higher Post GDP, Resistance Hovers Nearby
- Australian CPI Data Supports RBA’s Cautious Approach on Rate Cuts
- ASX 200 and Nikkei 225 Technical Outlook: Reversals and Key Levels in Focus
AUD/JPY Nears Key Levels, Household Spending Firms
The Australian dollar has been the strongest performer against the Japanese yen over the past two weeks. While the Bank of Japan (BOJ) continues to lower expectations of a rate hike, Australia’s economic data has surprised to the upside—further delaying expectations of an imminent rate cut by the Reserve Bank of Australia (RBA).
The monthly inflation report came in hotter than expected, with a notable rise in the trimmed mean CPI, suggesting inflationary pressures are not just due to electricity prices. Meanwhile, Q2 GDP was stronger than anticipated, thanks largely to robust domestic demand.
Today’s household spending data further reinforces the narrative of economic resilience. Total household spending rose 5.1% y/y in July, marking its fastest pace since November 2023. Month-on-month, spending was up 0.5%, while services spending climbed 1.6% m/m and 5.9% y/y.
While these levels aren’t historically high, the trend is clearly upward—especially for services. This is not what one would expect from an economy teetering on the edge of recession. Because, clearly, it is not. And that provides more reason for the RBA more reason to hold rates steady into Q4, and possibly into Q1 2026.
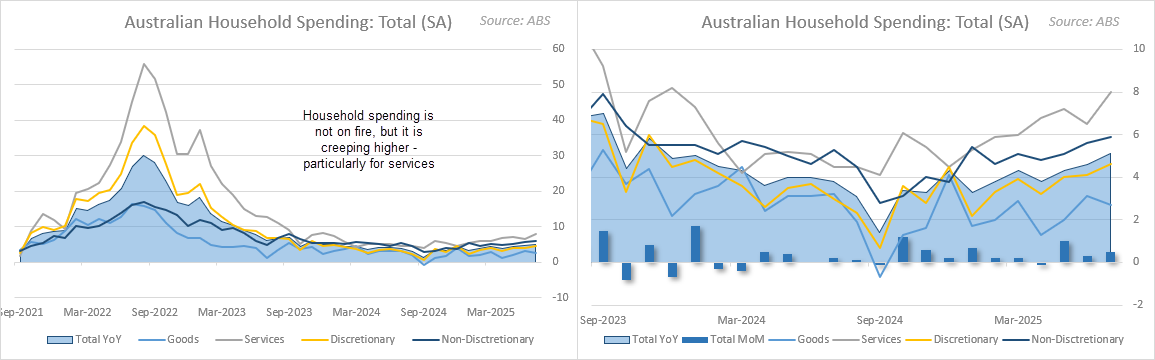
Chart analysis by Matt Simpson - data source: Australian Bureau of Statistics (ABS)
AUD/JPY Technical Analysis: Australian Dollar vs Japanese Yen
Barring a major risk-off event, AUD/JPY looks set to close higher for a second consecutive week. A strong bullish trend has emerged on the weekly chart, and the pair is now challenging the July high, following a relatively shallow retracement to the 23.6% Fibonacci level.
The weekly RSI (14) is confirming the upward move, while the RSI (2) remains below overbought territory—leaving room for further upside momentum. Unless the Bank of Japan (BOJ) unexpectedly turns hawkish or the Reserve Bank of Australia (RBA) adopts a dovish stance, the setup favours a bullish breakout, potentially targeting the 97.43 high.
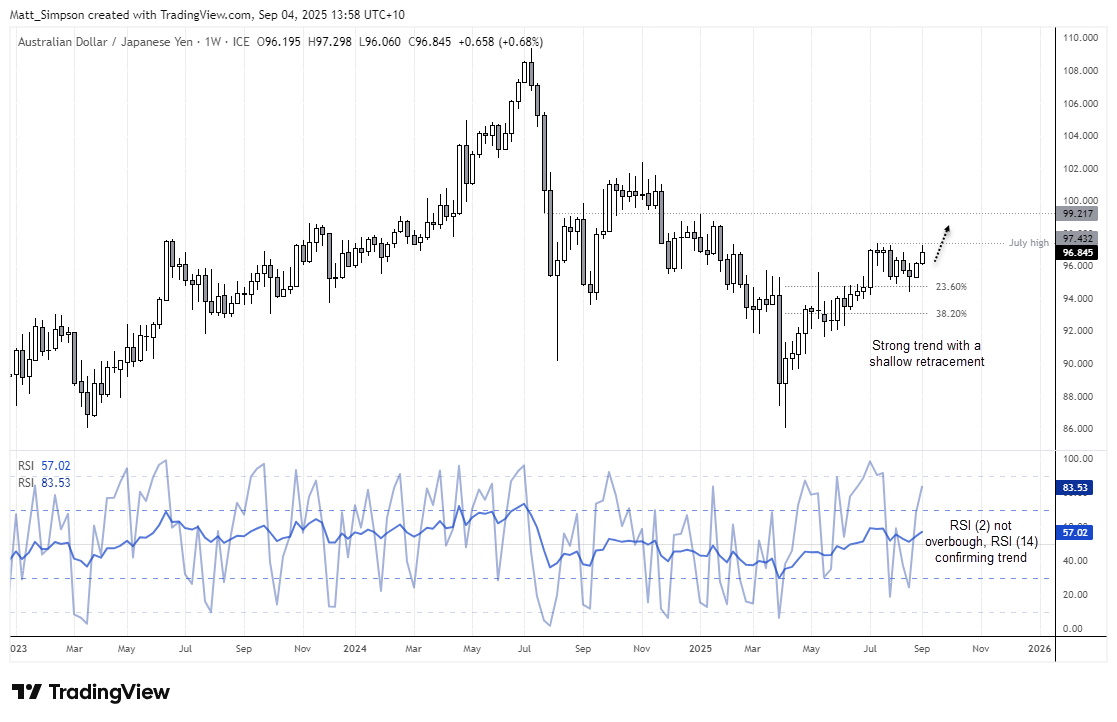
Chart analysis by Matt Simpson – data source: TradingView AUD/JPY
AUD/JPY Technical Analysis: Daily Chart
Bulls may be pushing their luck in the near term. AUD/JPY has now closed higher for 10 consecutive sessions—its longest bullish run since October 2015. While this doesn’t guarantee a strong pullback, the probability of a short-term pause or retracement is growing with each additional up day.
Adding to the caution, a shooting star candle formed on Wednesday, and the daily RSI (2) has remained overbought for two days, now sitting at its highest level since July 2024—which coincided with the top before an 18% decline from 109.30.
With the July high nearby and multiple signs of upside exhaustion, bulls may prefer to wait for a pullback to seek dip-buying opportunities. Alternatively, a breakout above resistance could provide the setup to see whether former resistance turns into support.
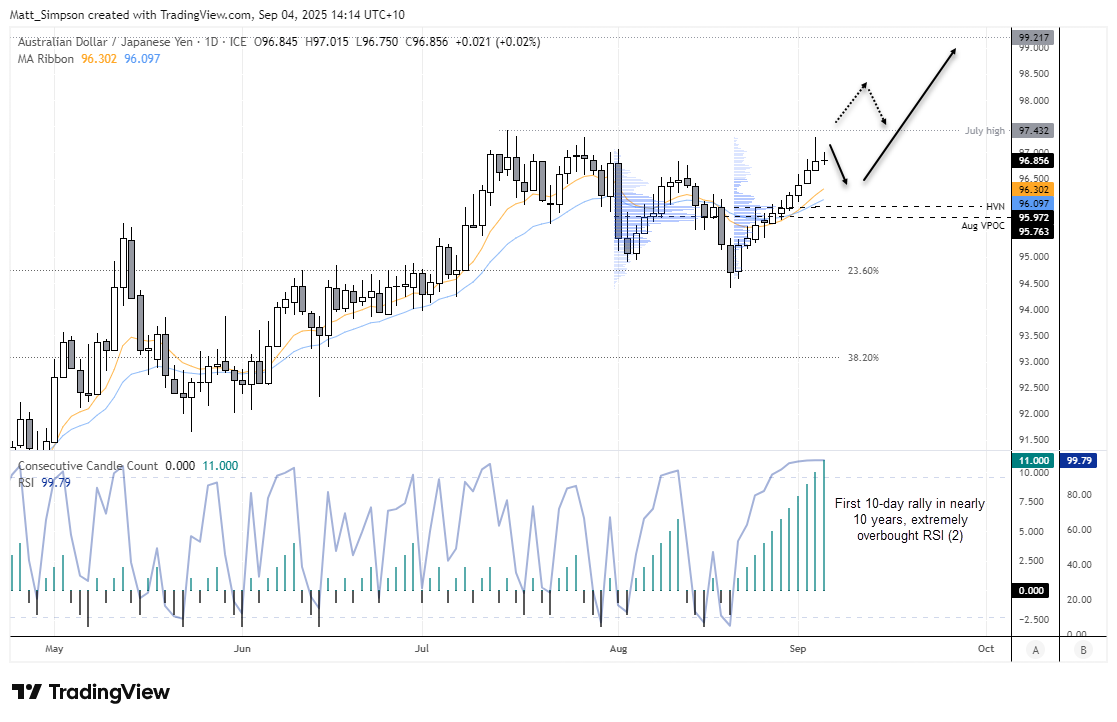
Chart analysis by Matt Simpson - data source: Australian Bureau of Statistics (ABS)
View the full economic calendar
-- Written by Matt Simpson
Follow Matt on Twitter @cLeverEdge
How to trade with City Index
You can trade with City Index by following these four easy steps:
- Open an account, or log in if you’re already a customer
• Open an account in the UK
• Open an account in Australia
• Open an account in Singapore
- Search for the market you want to trade in our award-winning platform
- Choose your position and size, and your stop and limit levels
- Place the trade


