


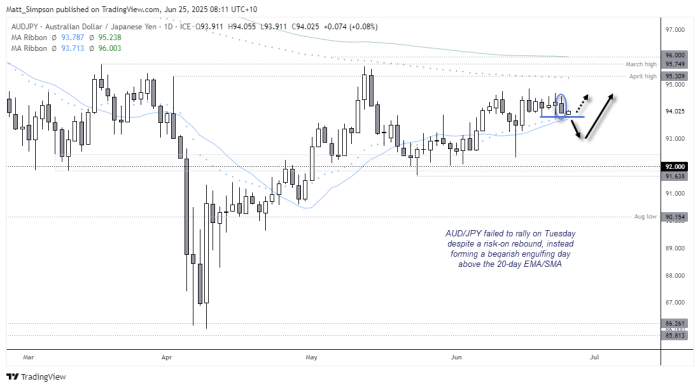
The Australian dollar is struggling to maintain upward momentum against the Japanese yen, with AUD/JPY failing to follow through on a bullish setup despite a broader risk-on rebound. After carving out a bullish hammer and range expansion above 92.00 last week, bulls were eyeing a move toward 95.50 and 96.00. Yet, recent price action has turned cautious. Tuesday’s bearish engulfing candle and a failure to hold gains above the 20-day EMA and SMA suggest bearish pressure is building. A downside break beneath 93.70 could expose deeper support levels as short-term sentiment shifts.
View related analysis:
- EUR/USD Bulls Gain Ground, NZD/USD Bullish Bets Surge: COT report
- Crude Oil Crashes as Iran's Muted Response Fuels Wall Street Rebound
- AUD/USD Weekly Outlook: Aussie Slides as Oil Surges on Middle East Tensions
- AUD/JPY Eyes Breakout as Bulls Defend Support Ahead of Jobs Data
AUD/JPY Technical Analysis: Australian Dollar vs Japanese Yen
Last week, I outlined a bullish bias for AUD/JPY, targeting a move towards 95.50 and 96.00. The bullish hammer above 92.00 and subsequent bullish range expansion day looked promising—especially with an inverted head and shoulders (H&S) pattern forming on the 1-hour chart. However, four days later, bullish momentum has failed to follow through, and Japanese yen bears may now have a slight upper hand over the Australian dollar.
The daily chart for AUD/JPY shows a small bearish engulfing candle forming on Tuesday, following a wide-legged Doji that signalled elevated volatility within the recent sideways range. This pattern has ultimately resolved with a dip lower. The failure of AUD/JPY to rally during a broader risk-on rebound also raises a red flag, and puts a potential downside break firmly on the radar.
A break beneath 93.70 would see prices beneath its recent range and also clear the 20-day SMA and EMA to suggest a countertrend move is on the cards.

AUD/JPY Technical Analysis: 1-Hour Chart
The 1-hour chart shows AUD/JPY has been oscillating between the 93.80–94.75 zone over the past week. Prices have drifted toward the lower bounds of that range, though AUD/JPY is attempting to carve out a swing low above the 38.2% Fibonacci retracement level.
Given the 1-hour RSI (2) reached an extremely oversold reading of 3.2 overnight, the bias is for a minor bounce before prices potentially break lower from the range. Bears could look to fade into intraday rallies if a swing high appears to form on the 1-hour chart.


Economic Events in Focus (AEST / GMT+10)
08:00 NZD Trade Balance (May), Exports, Imports (NZD/USD, NZX 50)
09:50 JPY BoJ Summary of Opinions, Corporate Services Price Index (CSPI) (YoY) (USD/JPY, Nikkei 225)
10:15 USD Fed Schmid Speaks (USD, S&P 500, Nasdaq 100, Dow Jones, Gold, Crude Oil)
11:00 JPY BoJ Tamura Speaks (USD/JPY, Nikkei 225)
11:30 AUD Weighted Mean CPI (YoY) (May) (AUD/USD, ASX 200)
14:00 GBP Car Registration (MoM, YoY) (May) (GBP/USD, FTSE 100)
14:00 EUR German Car Registration (MoM, YoY) (May) (EUR/USD, DAX)
15:00 JPY Leading Index, Coincident Indicator (Apr) (USD/JPY, Nikkei 225)
18:00 CHF ZEW Expectations (Jun) (USD/CHF, SMI)
19:00 GBP 15-Year Treasury Gilt Auction (GBP/USD, FTSE 100)
21:00 USD MBA Mortgage Applications, Refinance Index, Purchase Index, Market Index, 30-Year Mortgage Rate (USD, S&P 500, Nasdaq 100, Dow Jones)
22:30 USD Building Permits (May) (USD, S&P 500, Nasdaq 100, Dow Jones, Gold, Crude Oil)
23:00 CHF SNB Quarterly Bulletin (USD/CHF, SMI)
00:00 USD Fed Chair Powell Testifies, New Home Sales (May) (USD, S&P 500, Nasdaq 100, Dow Jones)
00:30 USD Crude Oil Inventories, EIA Stockpiles, Refinery Runs, Gasoline & Heating Oil Data (USD, Crude Oil, S&P 500)
01:00 CAD Budget Balance (Apr) (USD/CAD, TSX)
02:00 USD 5-Year Note Auction (USD, Treasury Market)


