


The Australian and New Zealand dollars are showing important technical setups across major pairs. AUD/USD is pressing against resistance with a bullish bias, AUD/NZD is flashing exhaustion signals after a strong rally, while NZD/USD is building momentum off key Fibonacci support. With upcoming economic events in focus, these cross-rates provide tactical opportunities for traders watching the Asia-Pacific FX space.
View related analysis:
- USD/JPY, AUD/USD, Gold Analysis: COT report
- AUD/USD Weekly Outlook: Australian Dollar Bulls Eye Breakout of 66c
- AUD/JPY Outlook: First 10-Day Rally in 10 Years Faces Resistance
AUD/USD, AUD/NZD, NZD/USD Technical Analysis
AUD/USD Technical Analysis: Australian Dollar vs US Dollar
I outlined my bullish bias for AUD/USD to break above the 0.6600 handle in my weekly Australian Dollar outlook, and the pair came close on Monday, touching the level at the session high.
However, the hesitation to break higher suggests near-term caution, reinforced by the US Dollar Index holding above key support at 97.45. Still, the broader outlook favours an eventual breakout unless sentiment sours or this week’s US inflation data surprises to the upside.
Daily RSI (14) supports the bullish case, trending higher without yet reaching overbought territory. This leaves room for AUD/USD bulls to treat dips as opportunities. Monday’s low at 0.6545 and last week’s VPOC at 0.6542 provide a potential support zone for buyers, while resistance pivots around 0.6642–0.6647 and the 200-week moving average sit just below the November high at 0.6688.
If a deeper retracement unfolds, the high-volume node (HVN) at 0.6518 could offer support. Overall, the bias remains for a breakout while prices hold above the 0.6480 swing low.
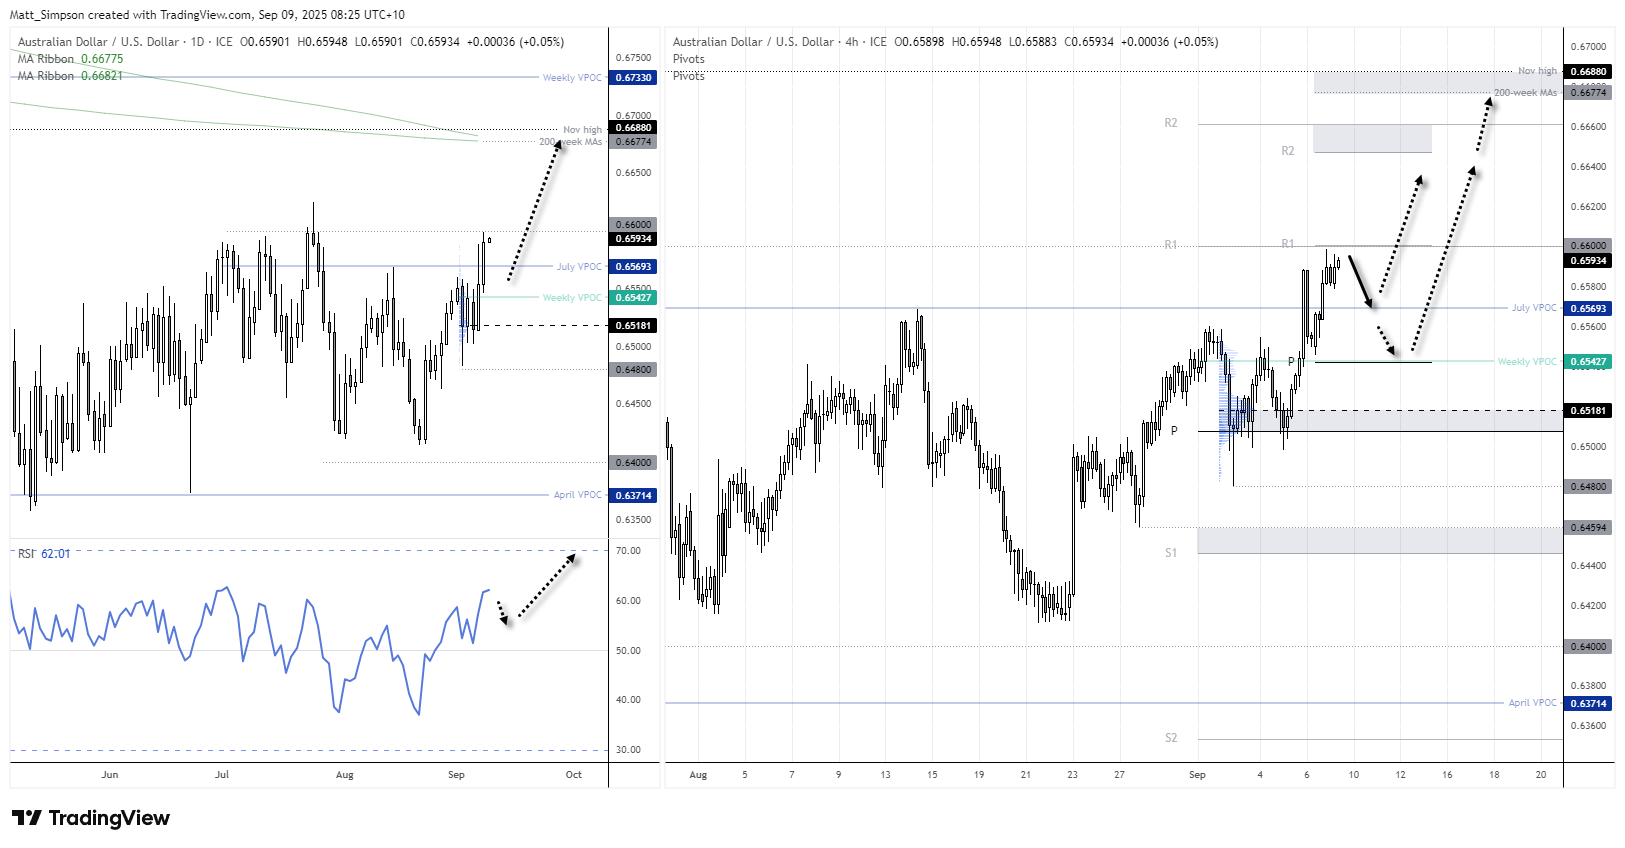
Chart analysis by Matt Simpson - data source: TradingView AUD/USD
AUD/NZD Technical Analysis: Australian Dollar vs New Zealand Dollar
The Australian dollar has enjoyed a solid rally against the New Zealand dollar since the April low. And with the RBA unlikely to be cutting rates soon, we may now see a massive pullback on AUD/NZD. However, one may be required after such a rally, and prices are showing near term signs of exhaustion beneath historical highs.
AUD/NZD has just completed a 6-week rally, which is its most bullish sequence since January 2021. A spinning top doji also formed last week around the July 2024 high (1.1514) and momentum is also trying to turn lower. Perhaps a cheeky pullback to 1.1050 could be due.
The daily chart shows the daily RSI (14) and (2) reached extremely overbought levels before a two-day decline took place. Bears could seek to fade into minor retracements within the two day range as part of some bearish mean reversion, and use the 20-day SMA (1.1064), monthly pivot point (1.1039) and 1.1031 high as potential targets over the near term.
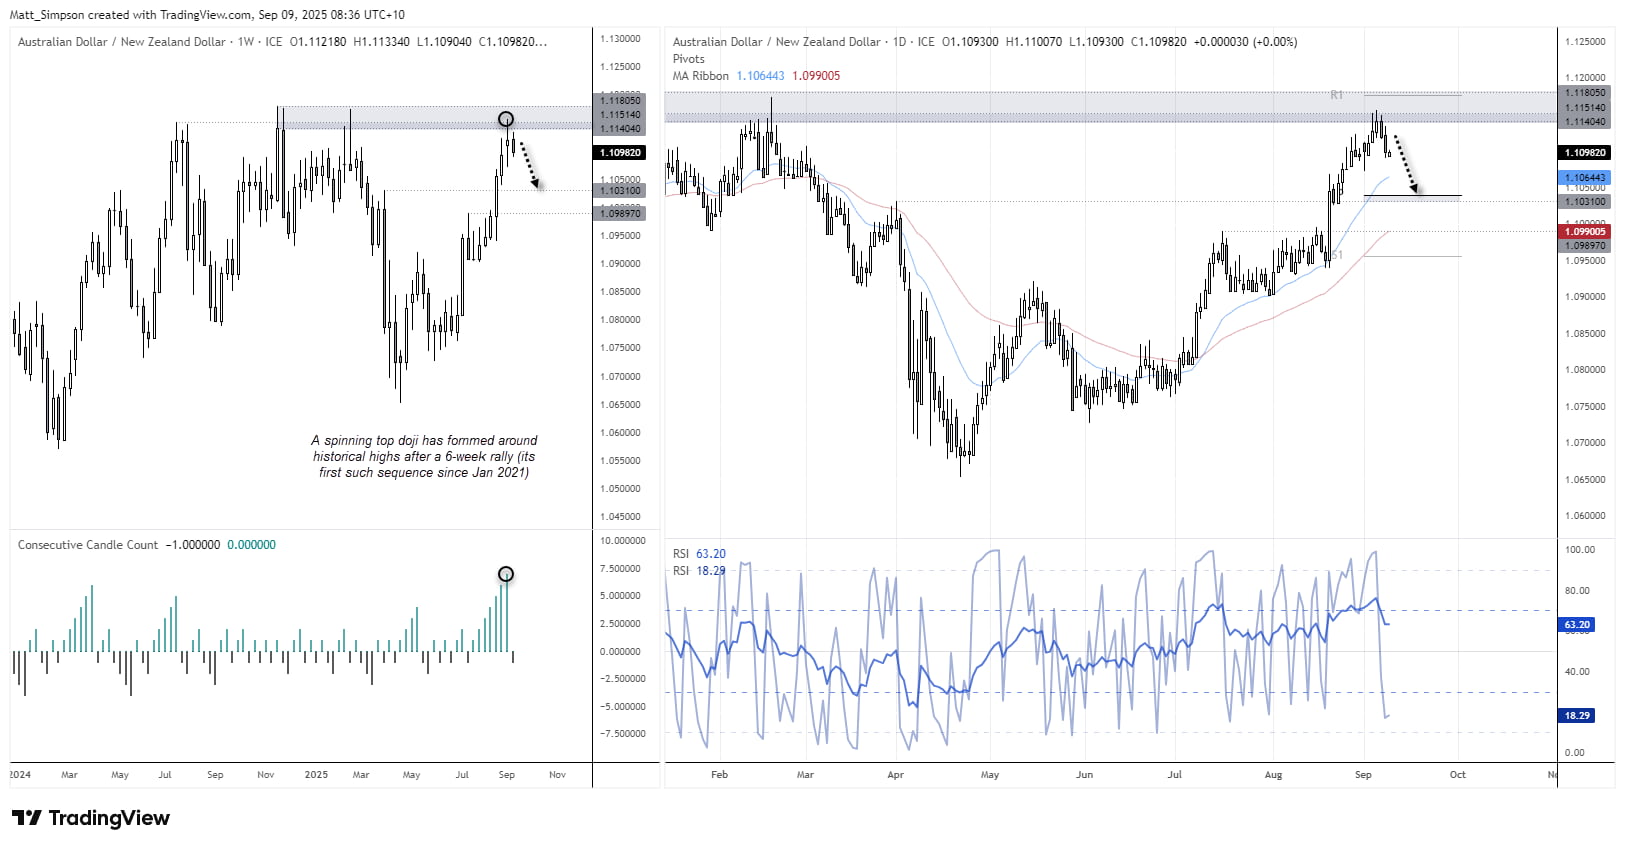
Chart analysis by Matt Simpson - data source: TradingView AUD/NZD
NZD/USD Technical Analysis: New Zealand Dollar vs US Dollar
To complete the forex triangle, NZD/USD is showing signs of building bullish momentum. This aligns with a bullish AUD/USD outlook and a bearish AUD/NZD bias, as the New Zealand dollar would need to outperform the Australian dollar for mean reversion to play out.
On the weekly chart, NZD/USD’s pullback from the 0.6120 high respected the 50% retracement at 0.5800. Importantly, weekly closes held above the May low, despite three intra-week false breaks beneath 0.5847. The pattern also delivered two bullish hammer candles, setting the stage for this week’s bullish range expansion.
The daily chart confirms strength, with price breaking above a cluster of moving averages, including the 200-day EMA. Bulls are likely targeting a retest and eventual break above the 0.6000 handle, while maintaining a constructive bias so long as prices hold above the monthly pivot point.
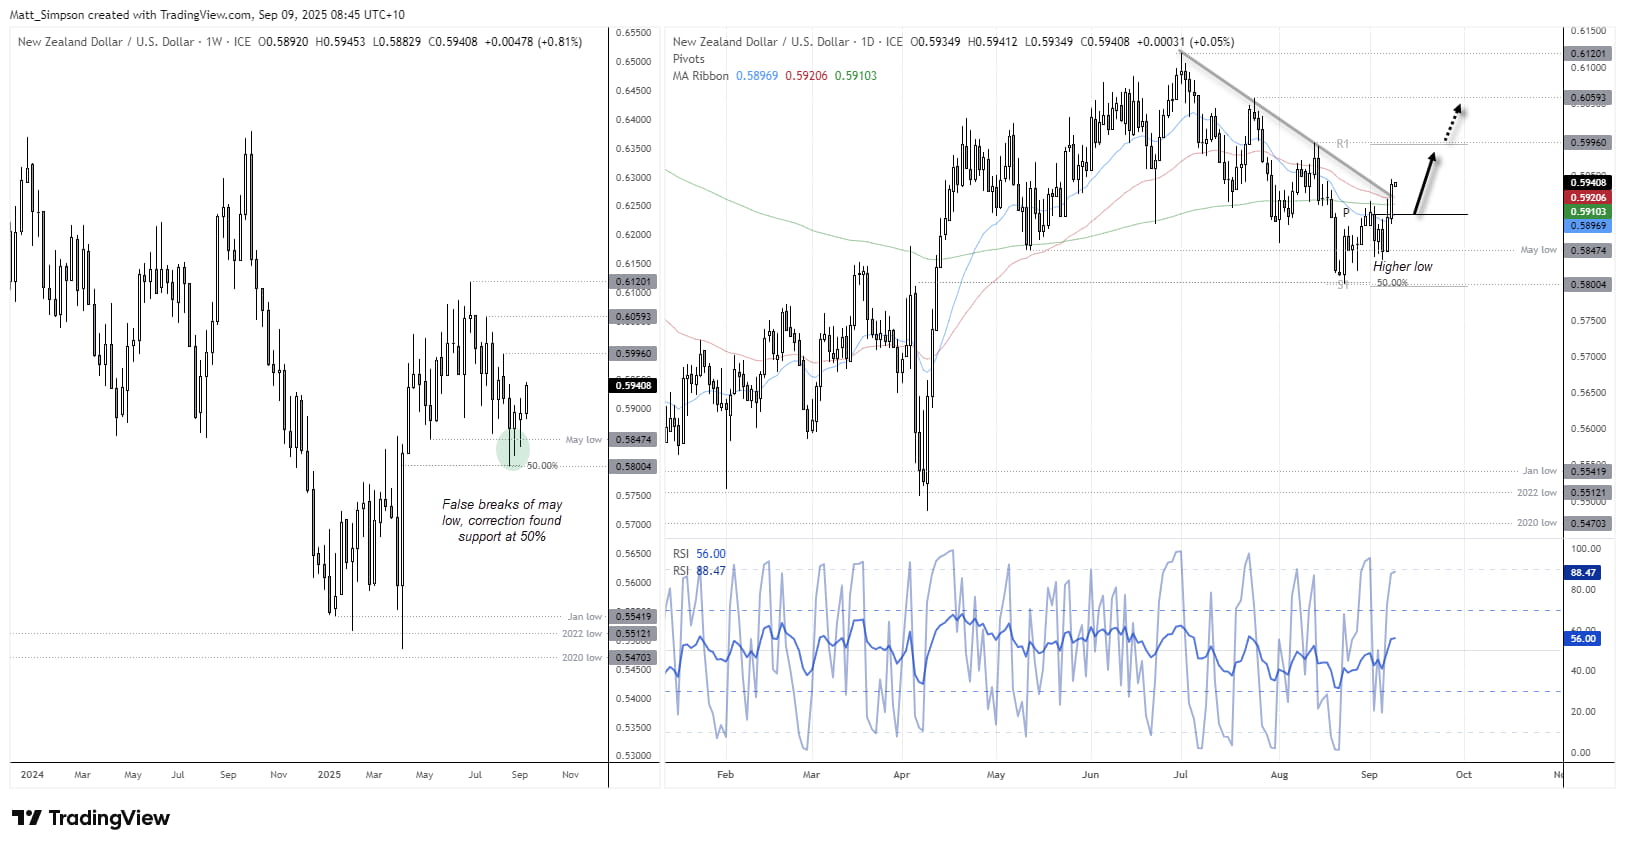
Chart analysis by Matt Simpson - data source: TradingView NZD/USD
Key Economic Events for Traders (AEST / GMT+10)
08:45 NZD Manufacturing Sales Volume (Q2) (NZD/USD, AUD/NZD, NZD/JPY)
09:01 GBP BRC Retail Sales Monitor (Aug) (GBP/USD, EUR/GBP, GBP/JPY)
09:30 AUD Westpac Consumer Sentiment (Sep) (AUD/USD, AUD/JPY, AUD/NZD)
09:50 JPY M2 Money Stock, M3 Money Supply (Aug) (USD/JPY, EUR/JPY, Nikkei 225)
10:30 AUD Westpac Consumer Sentiment (AUD/USD, AUD/JPY, AUD/NZD)
11:30 AUD NAB Business Confidence, NAB Business Survey (Aug) (AUD/USD, AUD/JPY, AUD/NZD)
16:00 JPY Machine Tool Orders (Aug) (USD/JPY, EUR/JPY, Nikkei 225)
16:00 NOK PPI (Aug) (EUR/NOK, USD/NOK, NOK/SEK)
20:00 USD NFIB Small Business Optimism (Aug) (S&P 500, Nasdaq 100, USD/JPY)
20:00 EUR Eurogroup Meetings (EUR/USD, EUR/GBP, DAX)
21:30 EUR German Buba President Nagel Speaks (EUR/USD, EUR/GBP, DAX)
21:50 CHF SNB Vice Chairman Schlegel Speaks (USD/CHF, EUR/CHF, CHF/JPY)
22:55 USD Redbook (S&P 500, Nasdaq 100, USD/JPY)
00:00 USD Payrolls Benchmark (S&P 500, Nasdaq 100, USD/JPY)
01:15 GBP BoE Breeden Speaks (GBP/USD, EUR/GBP, GBP/JPY)
View the full economic calendar
-- Written by Matt Simpson
Follow Matt on Twitter @cLeverEdge
How to trade with City Index
You can trade with City Index by following these four easy steps:
- Open an account, or log in if you’re already a customer
• Open an account in the UK
• Open an account in Australia
• Open an account in Singapore
- Search for the market you want to trade in our award-winning platform
- Choose your position and size, and your stop and limit levels
- Place the trade


